. 2007 Sep 1;309(1):113-25.
doi: 10.1016/j.ydbio.2007.06.024. Epub 2007 Jul 6.

3D analysis of founder cell and fusion competent myoblast arrangements outlines a new model of myoblast fusion

Affiliations

3D analysis of founder cell and fusion competent myoblast arrangements outlines a new model of myoblast fusion

Karen Beckett et al. Dev Biol. .

Abstract

Formation of the Drosophila larval body wall muscles requires the specification, coordinated cellular behaviors and fusion of two cell types: Founder Cells (FCs) that control the identity of the individual muscle and Fusion Competent Myoblasts (FCMs) that provide mass. These two cell types come together to control the final size, shape and attachment of individual muscles. However, the spatial arrangement of these cells over time, the sequence of fusion events and the contribution of these cellular relationships to the fusion process have not been addressed. We analyzed the three-dimensional arrangements of FCs and FCMs over the course of myoblast fusion and assayed whether these issues impact the process of myoblast fusion. We examined the timing of the fusion process by analyzing the fusion profile of individual muscles in wild type and fusion mutants. We showed that there are two temporal phases of myoblast fusion in wild type embryos. Limited fusion events occur during the first 3 h of fusion, while the majority of fusion events occur in the remaining 2.5 h. Altogether, our data have led us to propose a new model of myoblast fusion where the frequency of myoblast fusion events may be influenced by the spatial arrangements of FCs and FCMs.


Figures
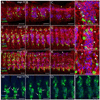
Figure 1
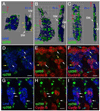
Figure 1. FC and FCM arrangements during myoblast fusion
Single optical slices of rp298-lacZ (A–L) or rp298-lacZ; twi-CD2 (M–P) stage 12 (A–D), 13 (E–F, M–P) and 14 (I–L) embryos labeled with anti-βgal to label FC/myotube nuclei (green), anti-Lmd to label FCMs (blue), phalloidin to label F-actin (red) and anti-CD2 to label mesodermal cell membranes (green) are shown. Panels on the left (A, E, I, M) are more external than those on the right (C, G, K, P). Panels D, H and L show close-ups of FCMs in panels B, F and J respectively. Dorsal is up and anterior is left and scale bars are 20 µm in all panels. The developing trachea (yellow arrows, A, B, F, H, K) were used for accurate staging of embryos (Manning and Krasnow, 1993). Mesodermal hemisegments narrow along the A–P axis and extend along the D–V axis during these stages due to germband retraction and dorsal closure (compare A–C with I–K). FCs/myotubes (green) are present in more external panels (A, E, I, M, N), but not more internal where the majority of FCMs (blue) are located (B, C, F, G, J, K, O, P). (A–H) FCs and FCMs are tightly packed together at stages 12 and 13 (white arrowheads, B–D, F–H, M–P). (I–L) However, during stage 14 the FCMs separate from one another and round up to become migratory (white arrowheads, J–L). FCMs in similar locations contact different cell types such as other FCMs, FCs/myotubes and epithelial cells (blue arrows, A, B, F, J). Fusion events can be visualized by colocalization of rp298-lacZ and Lmd (white arrow, E) and can be visualized using this approach from stage 13 onwards. (M–P) Myotubes containing two nuclei can be observed in external cell layers at late stage 13. No FCMs are observed in these cells layers at this stage. The visceral mesoderm is beneath the somatic mesoderm at stage 12 and expresses high levels of F-actin (yellow arrowheads, C).
Figure 2
Figure 2. Three-dimensional analysis of FC and FCM arrangements demonstrates that FCMs are not a uniform cell population
Stage 12 (A, D–F), 13 (B, G–I) and 14 (C) rp298-lacZ embryos were stained with antibodies against β-gal to label FC/myotube nuclei (green), Lmd to label FCMs (blue) and Cyclin B to label dividing cells (red). (A–C) Three-dimensional renderings of single mesodermal hemisegments at stage 12 (A, 1 grid unit = 5.7 µm), 13 (B, 1 grid unit = 10.9 µm) and 14 (C, 1 grid unit = 14.1 µm) are shown. Each panel shows an external view (left) and a side view rotated 90° clockwise (right). Red arrows point to dorsal, green arrows point to anterior and blue arrows point to external. SM stands for somatic mesoderm and VM stands for visceral mesoderm. The visceral mesoderm was identified based on position and expression of high levels of F-actin by phalloidin staining (Figure 1, data not shown). (A) At stage 12 the somatic mesoderm contains multiple layers and the FCs (green) are concurrently the most external and internal cells (yellow arrows, A), with the FCMs (blue) in between. The most ventral and interior FCMs contact the visceral FCs. (B) At stage 13, the internal FCs and FCMs have moved externally to underlay the overlaying epidermis (not labeled). The FCs (green) appear to rest on top of the FCMs (blue) at this stage and the cells are tightly packed together. (C) By stage 14, the number of rp298-lacZ expressing nuclei (green) have increased due to fusion. The FCMs (blue) have separated from one another. (D–I) Single confocal sections showing that a subset of FCMs undergo cell division during stages 12 and 13. At stage 12 (D–F) a small number of progenitor cells are still dividing to form FCs (yellow arrows, D–F). In addition a subset of FCMs are dividing in dorsal, lateral (white arrows, D–F) and ventral (data not shown) positions. By stage 13 no rp298-lacZ expressing cells are undergoing cell division, but a small number of FCMs are still dividing (white arrows, G–I). Proliferating non-mesodermal cells are located in close proximity to dividing FCMs (blue arrows, F, I).
Figure 3
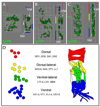
Figure 3. Three-dimensional analysis of FC arrangements shows organization into four groups
Stage 12 (A), 13 (B) and 14 (C) rp298-lacZ embryos were stained with an antibody against βgal to label FC/myotube nuclei (green). (A–C) Three-dimensional renderings of single mesodermal hemisegments at stage 12 (A, 1 grid unit = 5.7 µm), 13 (B, 1 grid unit = 10.9 µm) and 14 (C, 1 grid unit = 14.1 µm) are shown. Each panel shows an external view (left) and a side view rotated 90° clockwise (right). Red arrows point to dorsal, green arrows point to anterior and blue arrows point to external. SM stands for somatic mesoderm and VM stands for visceral mesoderm. The visceral mesoderm was identified based on position and expression of high levels of F-actin by phalloidin staining (data not shown). During these stages, FCs are organized into four groups in the dorsal (red), dorsal-lateral (yellow), lateral (green) and ventral (blue) somatic mesoderm. At stage 12 (A) the most ventral FCs are located internally. After germband retraction these cells move externally (B–C). Visceral FCs can be clearly seen in the absence of FCMs (put in arrows). These data gathered at each stage have been confirmed with specific FC identity markers. (D) A map of FC arrangements, at stage 13 when 30 FCs can be counted, based on the position and known sibling relationships of the FCs. This map was made by drawing over a flattened version of panel 3B to mark the positions of these cells. A map labeling the identity of each muscle is shown in Supplemental Figure 1.
Figure 4
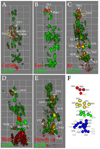
Figure 4. Analysis of FC identity markers outlines a three-dimensional map of FCs at stage 13
Stage 13 rp298-lacZ embryos were stained with antibodies against βgal (green, A–E), Collier (red, A), Eve (red, B), Kr (red, C), Runt (red, D) and Slouch (red, E). Three-dimensional renderings of single mesodermal hemisegments in each panel shows an external view. Dorsal is up in all panels and anterior is to the left. Each grid unit represents 10.6 µm (A, D), 11.2 µm (B), 11.3 µm (C) and 10.3 µm (E). Green arrows mark non-mesodermal expression of FC identity genes in the CNS or PNS. (A) Collier is expressed in the FCs for the DA3, DT1, DO4 and DO5 muscles. Fusion of the DA3 muscle has already begun at this stage (yellow arrows, A). (B) Eve is expressed in the FC for the DA1 muscle and two PCs. (C) Kr is expressed in the FCs for the DA1, DO1, LL1, LT2, LT4, VA2, VO2, VO5 and VL3 muscles. Fusion has begun in all Kr-positive muscles at this stage (yellow arrows, C). (D) Runt is expressed in the FCs for the DO2, VO3 and VO4 muscles. Fusion of the DO2 muscle has begun at this stage (yellow arrow, D). (E) Slouch is expressed in the FCs for the DT1, DO3, LO1, VT1 and VA1-3 muscles at this stage. Fusion has begun in the DT1 muscle at this stage (yellow arrow, E). The Slouch expressing ventral AP is also labeled (red arrow, E). (F) Map showing the identity and location of all FCs at stage 13. The dorsal (red), dorsal-lateral (yellow), lateral (green) and ventral (blue) groupings of the FCs are shown. FCs labeled in black are those confirmed using FC identity markers, while those labeled in grey show those identified based on position. A map showing the position and identity of all muscles in the final muscle pattern in shown in Supplemental Figure 1.
Figure 5
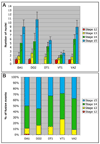
Figure 5. Wild type fusion profiles of individual muscles
Wild type stage 12–15 embryos were stained with antibodies against Eve (DA1), Runt (DO2) or Slouch (DT1, VT1 and VA2) in combination with phalloidin to assist accurate staging. The number of nuclei for each muscle and stage were counted in 50 hemisegments (A2–4). (A) Bar graph showing the mean number of nuclei for each muscle at each stage. Error bars show one standard deviation from the mean. For each muscle, the majority of fusion occurs in stages 14–15. The stage 12 value for the DT1 muscle was not determined due to an inability to detect Slouch expression. (B) Histogram showing the percentage of fusion events that occur during each stage for each muscle during the course of fusion (7.5–13 hours AEL). The mean number of nuclei observed for each muscle at stage 15 is 100% and a single nucleus is 0%. The numbers used to plot this graph are shown in Supplemental Table 1. 9–27% of fusion occurs during stages 12–13 (7.5–10.5 hours AEL), while the remaining 73–91% of fusion occurs during stages 14–15 (10.5–13 hours AEL).
Figure 6
Figure 6. Fusion profile of the DA1 and DO2 muscles for wild type and fusion mutant embryos shows two classes of fusion mutants
Stage 12–15 wildtype, blow, loner, mbc, kette, rac and rols mutant embryos were stained with antibodies against Eve (DA1, A–B) or Runt (DO2, C–D) in combination with phalloidin (see text). The number of nuclei for each muscle and stage were counted in 50 hemisegments (A2–4). (A, C) Bar graphs showing the mean number of nuclei in the DA1 (A) and DO2 (C) muscles at each stage in each genotype. Error bars show one standard deviation from the mean. For each muscle two classes of fusion mutants were observed. The first class showed almost no fusion and included blow, loner and mbc. The second class showed limited fusion and included kette, rac and rols. The second class of fusion mutants showed fusion at all stages. (B, D) Histograms showing the percentage of fusion events that occur during each stage for each mutant during the course of fusion (7.5–13 hours AEL). The mean number of nuclei observed for each mutant at stage 15 is 100% and a single nucleus is 0%. The numbers used to plot these graphs are shown in Supplemental Table 2 and Supplemental Table 3. Fusion is observed at all stages of fusion independent of the number of fusion events that occur.
Figure 7
Figure 7. Model figure showing two temporal phases of myoblast fusion
During stage 12–13 (7.5–10.5 hours AEL) FCs (red and green) are located externally to the FCMs (blue) and all cells are tightly packed together. There is limited fusion during this time. During stage 14–15 (10.5–13 hours AEL) the FCMs (blue) separate from one another, migrate externally and fuse to growing myotubes (red and green). The majority of fusion events occur during this time. We propose that these two temporal phases are due to differences in the frequency of individual fusion events and that expression of limiting factors during the first phase, and the initiation of FCM migration at the beginning of the second phase, are responsible for the transition between the two phases. This model combined with detailed analysis of fusion mutants predicts that subcellular behaviors such as prefusion complex and plaque formation occur at all stages of the fusion process.

Similar articles

Cited by

References

    1. Abmayr SM, Kocherlakota KS. Muscle Morphogenesis: The Process of Embryonic Myoblast Fusion. In: Sink H, editor. Muscle Development in Drosophila. New York: Springer Science + Business Media, Inc.; 2006.
    1. Artero R, Furlong EE, Beckett K, Scott MP, Baylies M. Notch and Ras signaling pathway effector genes expressed in fusion competent and founder cells during Drosophila myogenesis. Development. 2003;130:6257–6272. - PubMed
    1. Artero RD, Castanon I, Baylies MK. The immunoglobulin-like protein Hibris functions as a dose-dependent regulator of myoblast fusion and is differentially controlled by Ras and Notch signaling. Development. 2001;128:4251–4264. - PubMed
    1. Bate M. The embryonic development of larval muscles in Drosophila. Development. 1990;110:791–804. - PubMed
    1. Bate M. The mesoderm and its derivatives. In: MMA Bate A, editor. The Development of Drosophila melanogaster. New York: Cold Spring Harbor Laboratory Press; 1993.

Publication types

LinkOut - more resources