Genome-wide analyses reveal properties of redundant and specific promoter occupancy within the ETS gene family
- PMID: 17652178
- PMCID: PMC1935027
- DOI: 10.1101/gad.1561707
Genome-wide analyses reveal properties of redundant and specific promoter occupancy within the ETS gene family
Abstract
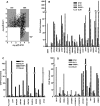
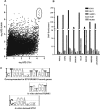
The conservation of in vitro DNA-binding properties within families of transcription factors presents a challenge for achieving in vivo specificity. To uncover the mechanisms regulating specificity within the ETS gene family, we have used chromatin immunoprecipitation coupled with genome-wide promoter microarrays to query the occupancy of three ETS proteins in a human T-cell line. Unexpectedly, redundant occupancy was frequently detected, while specific occupancy was less likely. Redundant binding correlated with housekeeping classes of genes, whereas specific binding examples represented more specialized genes. Bioinformatics approaches demonstrated that redundant binding correlated with consensus ETS-binding sequences near transcription start sites. In contrast, specific binding sites diverged dramatically from the consensus and were found further from transcription start sites. One route to specificity was found--a highly divergent binding site that facilitates ETS1 and RUNX1 cooperative DNA binding. The specific and redundant DNA-binding modes suggest two distinct roles for members of the ETS transcription factor family.
Figures


Similar articles
-
DNA specificity determinants associate with distinct transcription factor functions.PLoS Genet. 2009 Dec;5(12):e1000778. doi: 10.1371/journal.pgen.1000778. Epub 2009 Dec 18. PLoS Genet. 2009. PMID: 20019798 Free PMC article.
-
Regulation of the human leukemia inhibitory factor gene by ETS transcription factors.Neuroimmunomodulation. 2004;11(1):10-9. doi: 10.1159/000072964. Neuroimmunomodulation. 2004. PMID: 14557674
-
The human CD6 gene is transcriptionally regulated by RUNX and Ets transcription factors in T cells.Mol Immunol. 2009 Jul;46(11-12):2226-35. doi: 10.1016/j.molimm.2009.04.018. Epub 2009 May 14. Mol Immunol. 2009. PMID: 19446338
-
Genomic and biochemical insights into the specificity of ETS transcription factors.Annu Rev Biochem. 2011;80:437-71. doi: 10.1146/annurev.biochem.79.081507.103945. Annu Rev Biochem. 2011. PMID: 21548782 Free PMC article. Review.
-
Molecular analysis of the ets genes and their products.Crit Rev Oncog. 1990;1(4):409-36. Crit Rev Oncog. 1990. PMID: 1964597 Review.
Cited by
-
Mechanism and relevance of EWS/FLI-mediated transcriptional repression in Ewing sarcoma.Oncogene. 2013 Oct 17;32(42):5089-100. doi: 10.1038/onc.2012.525. Epub 2012 Nov 26. Oncogene. 2013. PMID: 23178492 Free PMC article.
-
Rapid profiling of transcription factor-cofactor interaction networks reveals principles of epigenetic regulation.Nucleic Acids Res. 2024 Sep 23;52(17):10276-10296. doi: 10.1093/nar/gkae706. Nucleic Acids Res. 2024. PMID: 39166482 Free PMC article.
-
Dissecting the regulatory activity and sequence content of loci with exceptional numbers of transcription factor associations.Genome Res. 2020 Jul;30(7):939-950. doi: 10.1101/gr.260463.119. Epub 2020 Jul 2. Genome Res. 2020. PMID: 32616518 Free PMC article.
-
The transcription factor ERG recruits CCR4-NOT to control mRNA decay and mitotic progression.Nat Struct Mol Biol. 2016 Jul;23(7):663-72. doi: 10.1038/nsmb.3243. Epub 2016 Jun 6. Nat Struct Mol Biol. 2016. PMID: 27273514
-
The ETS transcription factors ELK1 and GABPA regulate different gene networks to control MCF10A breast epithelial cell migration.PLoS One. 2012;7(12):e49892. doi: 10.1371/journal.pone.0049892. Epub 2012 Dec 20. PLoS One. 2012. PMID: 23284628 Free PMC article.
References
-
- Aerts S., Van Loo P., Thijs G., Moreau Y., De Moor B., Van Loo P., Thijs G., Moreau Y., De Moor B., Thijs G., Moreau Y., De Moor B., Moreau Y., De Moor B., De Moor B. Computational detection of cis-regulatory modules. Bioinformatics. 2003;19 (Suppl. 2):II5–II14. - PubMed
-
- Bailey T.L., Elkan C., Elkan C. Fitting a mixture model by expectation maximization to discover motifs in biopolymers. In: Altman R., et al., editors. Proceedings of the second international conference on intelligent systems for molecular biology. AAAI Press; Menlo Park, CA: 1994. pp. 28–36. - PubMed
-
- Batchelor A.H., Piper D.E., de la Brousse F.C., McKnight S.L., Wolberger C., Piper D.E., de la Brousse F.C., McKnight S.L., Wolberger C., de la Brousse F.C., McKnight S.L., Wolberger C., McKnight S.L., Wolberger C., Wolberger C. The structure of GABPα/β: An ETS domain–ankyrin repeat heterodimer bound to DNA. Science. 1998;279:1037–1041. - PubMed
-
- Beissbarth T., Speed T.P., Speed T.P. GOstat: Find statistically overrepresented Gene Ontologies within a group of genes. Bioinformatics. 2004;20:1464–1465. - PubMed
-
- Bina M., Wyss P., Ren W., Szpankowski W., Thomas E., Randhawa R., Reddy S., John P.M., Pares-Matos E.I., Stein A., Wyss P., Ren W., Szpankowski W., Thomas E., Randhawa R., Reddy S., John P.M., Pares-Matos E.I., Stein A., Ren W., Szpankowski W., Thomas E., Randhawa R., Reddy S., John P.M., Pares-Matos E.I., Stein A., Szpankowski W., Thomas E., Randhawa R., Reddy S., John P.M., Pares-Matos E.I., Stein A., Thomas E., Randhawa R., Reddy S., John P.M., Pares-Matos E.I., Stein A., Randhawa R., Reddy S., John P.M., Pares-Matos E.I., Stein A., Reddy S., John P.M., Pares-Matos E.I., Stein A., John P.M., Pares-Matos E.I., Stein A., Pares-Matos E.I., Stein A., Stein A., et al. Exploring the characteristics of sequence elements in proximal promoters of human genes. Genomics. 2004;84:929–940. - PubMed
Publication types
MeSH terms
Substances
Grants and funding
LinkOut - more resources
Full Text Sources
Other Literature Sources
Molecular Biology Databases
Miscellaneous
