

Shared signaling networks active in B cells isolated from genetically distinct mouse models of lupus
- PMID: 17641780
- PMCID: PMC1913486
- DOI: 10.1172/JCI30398
Shared signaling networks active in B cells isolated from genetically distinct mouse models of lupus
Abstract
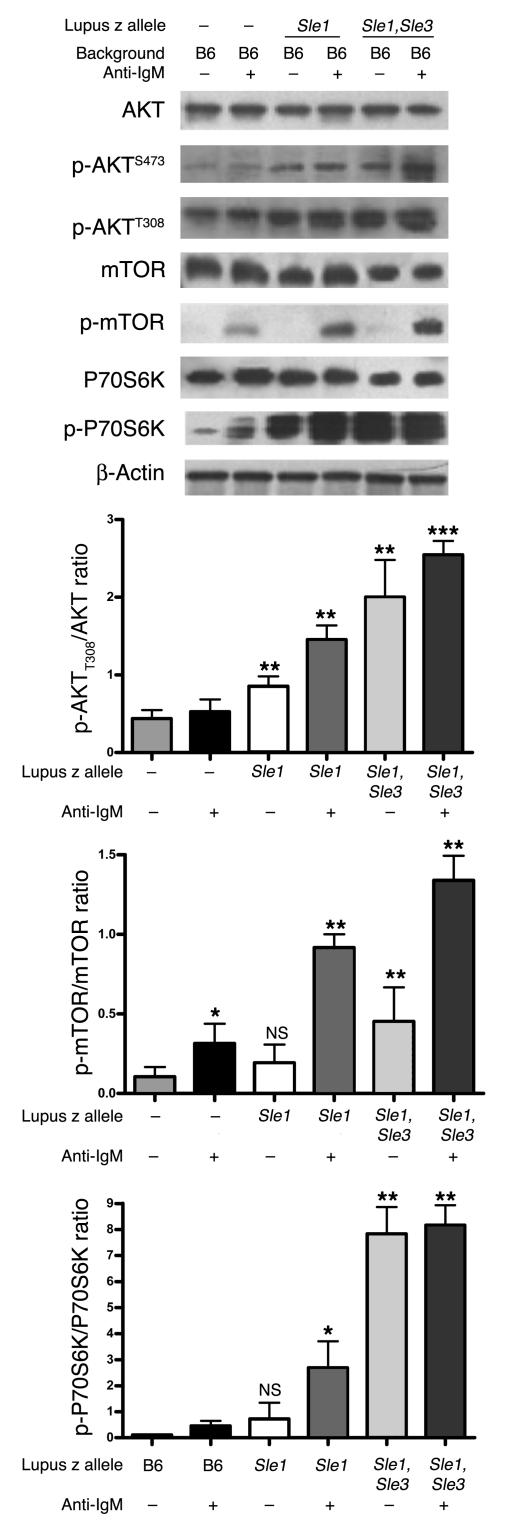
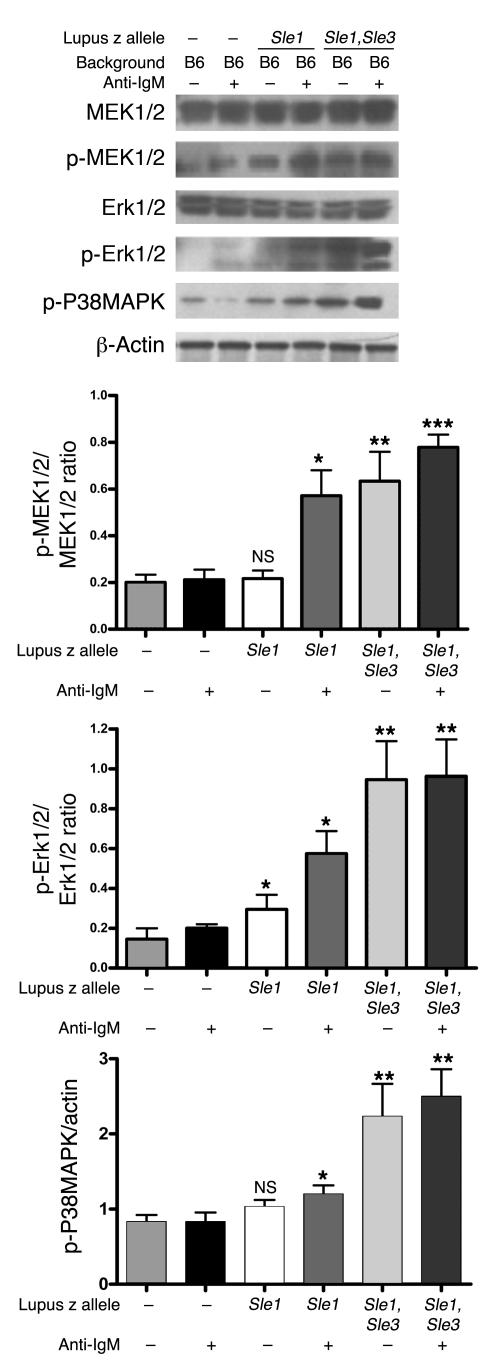
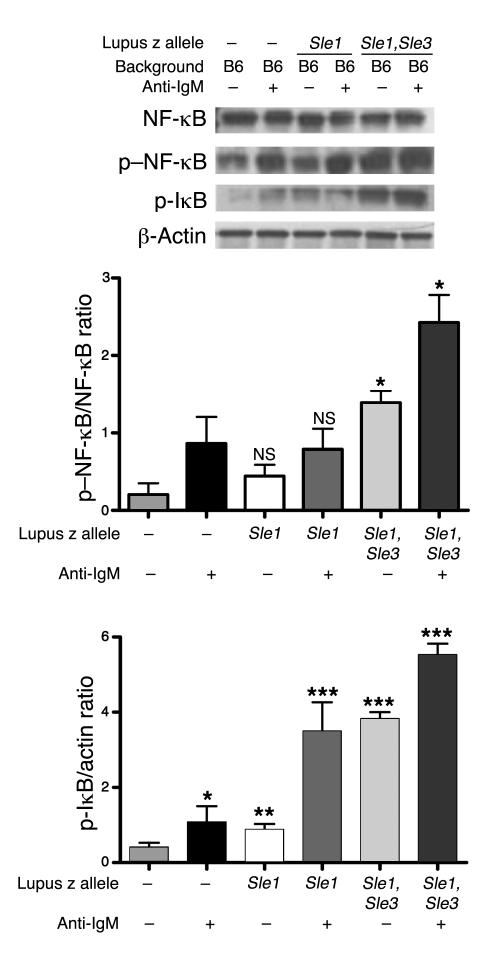
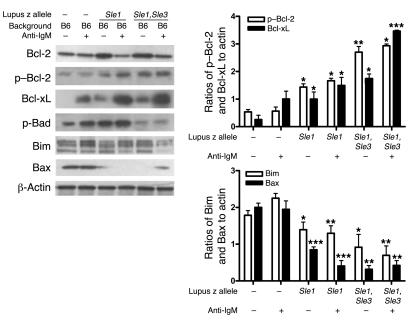
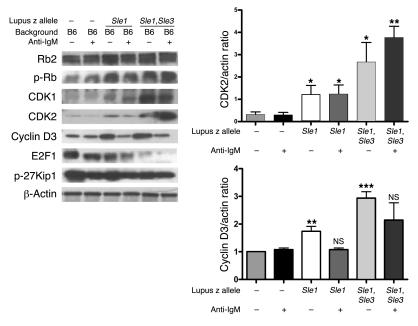
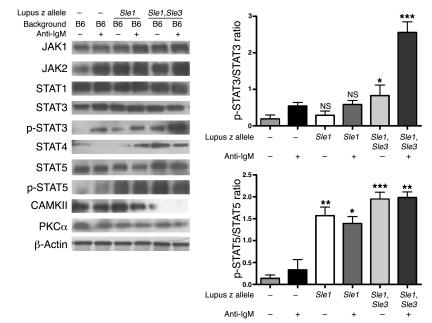
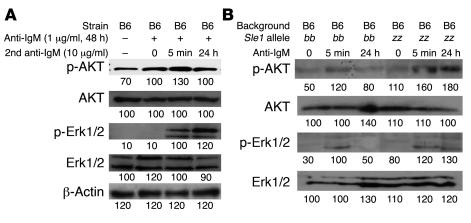
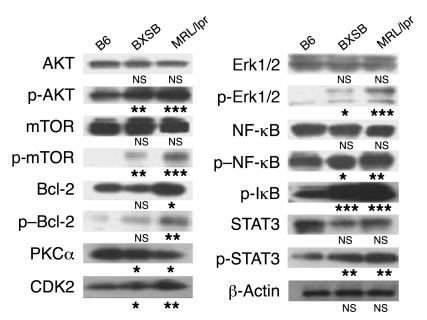
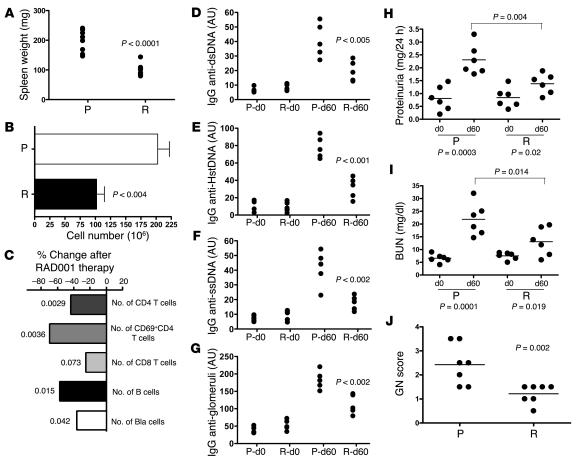
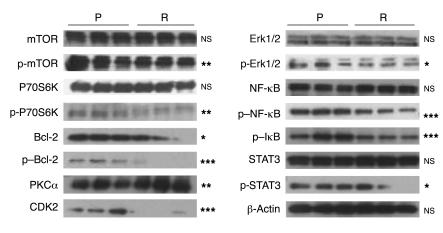
Though B cells play key roles in lupus pathogenesis, the molecular circuitry and its dysregulation in these cells as disease evolves remain poorly understood. To address this, a comprehensive scan of multiple signaling axes using multiplexed Western blotting was undertaken in several different murine lupus strains. PI3K/AKT/mTOR (mTOR, mammalian target of rapamycin), MEK1/Erk1/2, p38, NF-kappaB, multiple Bcl-2 family members, and cell-cycle molecules were observed to be hyperexpressed in lupus B cells in an age-dependent and lupus susceptibility gene-dose-dependent manner. Therapeutic targeting of the AKT/mTOR axis using a rapamycin (sirolimus) derivative ameliorated the serological, cellular, and pathological phenotypes associated with lupus. Surprisingly, the targeting of this axis was associated with the crippling of several other signaling axes. These studies reveal that lupus pathogenesis is contingent upon the activation of an elaborate network of signaling cascades that is shared among genetically distinct mouse models and raise hope that targeting pivotal nodes in these networks may offer therapeutic benefit.
Figures
Similar articles
-
Multiple signaling pathways promote B lymphocyte stimulator dependent B-cell growth and survival.Blood. 2008 Jan 15;111(2):750-60. doi: 10.1182/blood-2007-03-077222. Epub 2007 Oct 17. Blood. 2008. PMID: 17942753 Free PMC article.
-
Infection of Female BWF1 Lupus Mice with Malaria Parasite Attenuates B Cell Autoreactivity by Modulating the CXCL12/CXCR4 Axis and Its Downstream Signals PI3K/AKT, NFκB and ERK.PLoS One. 2015 Apr 24;10(4):e0125340. doi: 10.1371/journal.pone.0125340. eCollection 2015. PLoS One. 2015. PMID: 25909640 Free PMC article.
-
Oncogenic tyrosine kinase NPM/ALK induces activation of the rapamycin-sensitive mTOR signaling pathway.Oncogene. 2007 Aug 16;26(38):5606-14. doi: 10.1038/sj.onc.1210346. Epub 2007 Mar 12. Oncogene. 2007. PMID: 17353907
-
New targets for therapy in breast cancer: mammalian target of rapamycin (mTOR) antagonists.Breast Cancer Res. 2004;6(5):219-24. doi: 10.1186/bcr927. Epub 2004 Aug 12. Breast Cancer Res. 2004. PMID: 15318929 Free PMC article. Review.
-
New inhibitors of the mammalian target of rapamycin signaling pathway for cancer.Expert Opin Investig Drugs. 2010 Aug;19(8):919-30. doi: 10.1517/13543784.2010.499121. Expert Opin Investig Drugs. 2010. PMID: 20569080 Review.
Cited by
-
Systems biology of lupus: mapping the impact of genomic and environmental factors on gene expression signatures, cellular signaling, metabolic pathways, hormonal and cytokine imbalance, and selecting targets for treatment.Autoimmunity. 2010 Feb;43(1):32-47. doi: 10.3109/08916930903374774. Autoimmunity. 2010. PMID: 20001421 Free PMC article. Review.
-
Prolonged effects of short-term anti-CD20 B cell depletion therapy in murine systemic lupus erythematosus.Arthritis Rheum. 2010 Aug;62(8):2443-57. doi: 10.1002/art.27515. Arthritis Rheum. 2010. PMID: 20506300 Free PMC article.
-
A cellular overview of immunometabolism in systemic lupus erythematosus.Oxf Open Immunol. 2023 May 11;4(1):iqad005. doi: 10.1093/oxfimm/iqad005. eCollection 2023. Oxf Open Immunol. 2023. PMID: 37554724 Free PMC article. Review.
-
Recent Advances in Lupus B Cell Biology: PI3K, IFNγ, and Chromatin.Front Immunol. 2021 Jan 14;11:615673. doi: 10.3389/fimmu.2020.615673. eCollection 2020. Front Immunol. 2021. PMID: 33519824 Free PMC article. Review.
-
Review: Metabolic Control of Immune System Activation in Rheumatic Diseases.Arthritis Rheumatol. 2017 Dec;69(12):2259-2270. doi: 10.1002/art.40223. Epub 2017 Nov 8. Arthritis Rheumatol. 2017. PMID: 28841779 Free PMC article. Review.
References
-
- Kotzin B.L. Systemic lupus erythematosus. Cell. 1996;85:303–306. - PubMed
-
- Lipsky P.E. Systemic lupus erythematosus: an autoimmune disease of B cell hyperactivity. Nat. Immunol. . 2001;2:764–766. - PubMed
-
- Mohan C., Morel L., Yang P., Wakeland E.K. Genetic dissection of systemic lupus erythematosus pathogenesis: Sle2 on murine chromosome 4 leads to B cell hyperactivity. J. Immunol. 1997;159:454–465. - PubMed
-
- Haraldsson M.K., et al. Autoimmune alterations induced by the New Zealand Black Lbw2 locus in BWF1 mice. J. Immunol. 2005;174:5065–5073. - PubMed
Publication types
MeSH terms
Substances
Grants and funding
LinkOut - more resources
Full Text Sources
Other Literature Sources
Medical
Molecular Biology Databases
Miscellaneous
