. 2007 Jul 20;317(5836):376-81.
doi: 10.1126/science.1140956.

Host immune system gene targeting by a viral miRNA

Affiliations

Host immune system gene targeting by a viral miRNA

Noam Stern-Ginossar et al. Science. .

Abstract

Virally encoded microRNAs (miRNAs) have recently been discovered in herpesviruses. However, their biological roles are mostly unknown. We developed an algorithm for the prediction of miRNA targets and applied it to human cytomegalovirus miRNAs, resulting in the identification of the major histocompatibility complex class I-related chain B (MICB) gene as a top candidate target of hcmv-miR-UL112. MICB is a stress-induced ligand of the natural killer (NK) cell activating receptor NKG2D and is critical for the NK cell killing of virus-infected cells and tumor cells. We show that hcmv-miR-UL112 specifically down-regulates MICB expression during viral infection, leading to decreased binding of NKG2D and reduced killing by NK cells. Our results reveal a miRNA-based immunoevasion mechanism that appears to be exploited by human cytomegalovirus.


Figures

Fig. 1
Fig. 1
hcmv-miR-UL112 specifically down-regulates MICB expression and reduces NK cytotoxicity. For all panels, one representative experiment is shown out of at least three performed. (A) The predicted duplex of hcmv-miR-UL112 (red) and its target site (blue) in the 3′UTR of MICB (top) and MICA (bottom). (B) Ectopic expression of hcmv-miR-UL112 down-regulates MICB expression. Various human cell lines were transduced with lentiviruses expressing GFP either with hcmv-miR-UL112 (black histogram) or miR-control (open gray histogram). Expression levels of MHC class I, MICA, and MICB were assessed by FACS. (C) Ectopic expression of hcmv-miR-US5-1 does not affect MICB expression. Human cell lines were transduced with lentiviruses expressing GFP and either hcmv-miR-US5-1 (black histogram) or miR-control (open gray histogram). The expression levels of MICA and MICB were assessed by FACS. The histogram plots of (B) and (C) were gated only on the GFP-positive cells. Background levels for (B) and (C) were measured by using only the secondary Cy5-conjugated Ab (gray solid histogram). (D) Reduced binding of NKG2D to cells expressing hcmv-miR-UL112. Binding of NKG2D-Ig to the RKO cells expressing miR-control, hcmv-miR-US5-1, or hcmv-miR-UL112 was assessed by FACS using NKG2D-Ig and the control CD99-Ig (Control-Ig) in various concentrations. (E) The reduced NKG2D-Ig binding is due to reduced MICB expression. The expression level of the various NKG2D ligands was assessed by FACS in RKO cells expressing hcmv-miR-UL112 (open red histogram), miR-control (open gray histogram), or hcmv-miR-US5-1 (open black histogram). The histogram plots are gated only on the GFP-positive cells. The background was measured as in (B) and (C) (solid gray histogram). (F) Reduced killing of RKO cells expressing hcmv-miR-UL112. Bulk NK cells were preincubated either with anti-NKG2D mAb (white) or with isotype-match control mAb (gray). Labeled RKO cells expressing miR-control or hcmv-miR-UL112 were then added and incubated for 5 hours at the indicated effector:target (E:T) ratios. The differences between the killing of the RKO cells expressing miR-control and those expressing hcmv-miR-UL112 in the presence of the isotype-matched control mAb were significant (P < 0.01, t test). Error bars represent standard deviation of replicates.
Fig. 2
Fig. 2
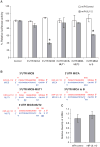
hcmv-miR-UL112 specifically binds to MICB-3′UTR and inhibits its translation. For all panels, one representative experiment is shown out of two performed. (A) hcmv-miR-UL112–mediated repression of luciferase reporter gene activity. The 3′UTR of MICA (303 nt) and a 350-nt segment of the 3′ UTR of MICB (including the predicted hcmv-miR-UL112 binding site) were inserted downstream of a firefly luciferase open reading frame. The figure demonstrates luciferase activity after the indicated reporter plasmids were transfected into HeLa cells expressing either hcmv-miR-UL112 (gray) or miR-control (white). Firefly luciferase activity was normalized to Renilla luciferase activity and then normalized to the average activity of the control reporter. Values are mean ± SD for triplicate samples. *Statistically significant difference between cells expressing miR-control and those expressing hcmv-miR-UL112 (P < 0.005 by t test). (B) Schematic representation of the mutations made in MICB and MICA 3′UTRs (blue) and their base-pairings with hcmv-miR-UL112 (red). Mutated positions are underlined. (C) qPCR analysis of MICB. Experiments were performed with RKO cells expressing either miR-control or hcmv-miR-UL112. The levels of 18S ribosomal RNA were used as internal standard control. Values are mean ±SD for triplicate samples.
Fig. 3
Fig. 3
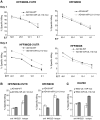
hcmv–miR-UL112–mediated down-regulation of MICB during authentic viral infection. (A and B) Time course expression of MICB (A) and MHC class I (B) on HFF cells expressing either MICB-3′UTR or only MICB. Cells were infected with either the AD169-wild-type virus (AD169-WT) or the AD169-miR-UL112 mutant virus (AD169-miR-UL112-mut). The expression levels of MICB (A) and MHC class I (B) were assessed by FACS staining (red histograms). The gray histograms represent staining of the corresponding uninfected cells. Background levels (black histogram) are the secondary fluorescein isothiocyanate (FITC)–conjugated Abs. (C) HFF cells expressing GFP or GFP fused to the 3′UTR of MICB were infected with either AD169-wild-type or with AD169-miR-UL112-mut viruses, and the levels of GFP expression were measured along the course of infection. The symbols represent the percentage of GFP compared to the corresponding uninfected cells. For (A) to (C), one representative experiment is shown out of three performed. (D) HUVECs were infected with either TB40 UL114-mutant virus (TB40-UL114P mut) or with the TB40 hcmv-miR-UL112 mutant virus (TB40-miR-UL112 mut), and the expression of MICB was measured (red histograms). The gray histograms represent the staining of the corresponding uninfected cells. Background levels (black histogram) are the secondary FITC-conjugated Abs. Shown is one representative experiment out of two performed.
Fig. 4
Fig. 4
hcmv-miR-UL112–mediated down-regulation of MICB during viral infection reduces NK cells cytotoxicity. Experiments were performed concomitantly with the FACS staining presented in Fig. 3. Error bars represent standard deviation of three replicates. Shown is one representative experiment out of two performed. (A) HFF cells expressing either MICB-3′UTR or MICB were infected with either AD169-WT (black) or with AD169-miR-UL112-mut viruses (gray) and incubated with bulk NK cells at the indicated effector:target (E:T) ratios. (B and C) Bulk NK cells were preincubated with either anti-NKG2D or with an isotype-match control mAb. In (B), HFF cells expressing either MICB-3′UTR or MICB that were infected for 3 days either with AD169-wild-type (white) or with AD169-miR-UL112-mut (gray) were then added at a final effector:target ratio of 20:1. In (C), HUVECs that were infected for 3 days either with TB40-UL114P mutant (white) or with TB40-miR-UL112 mutant (gray) were then added at a final effector:target ratio of 15:1.

Comment in

Similar articles

Cited by

References

    1. Bartel DP. Cell. 2004;116:281. - PubMed
    1. Pfeffer S, et al. Nat Methods. 2005;2:269. - PubMed
    1. Sullivan CS, Ganem D. Mol Cell. 2005;20:3. - PubMed
    1. Cullen BR. Nat Genet. 2006;38(suppl):S25. - PubMed
    1. French AR, Yokoyama WM. Curr Opin Immunol. 2003;15:45. - PubMed

Publication types

MeSH terms