. 2007 Aug 8;26(15):3616-28.
doi: 10.1038/sj.emboj.7601789. Epub 2007 Jul 12.

HP1alpha guides neuronal fate by timing E2F-targeted genes silencing during terminal differentiation

Affiliations

HP1alpha guides neuronal fate by timing E2F-targeted genes silencing during terminal differentiation

Irina Panteleeva et al. EMBO J. .

Abstract

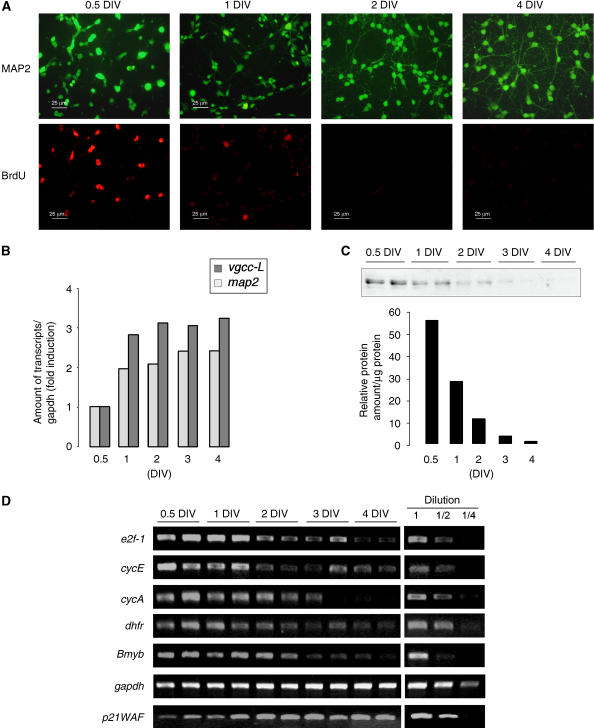
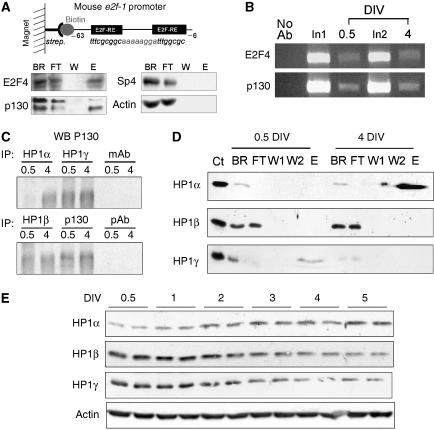
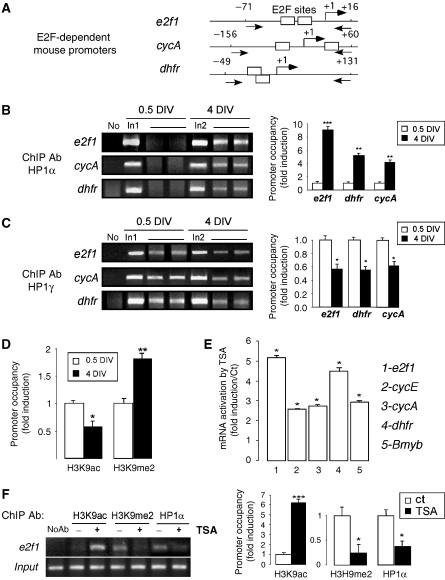
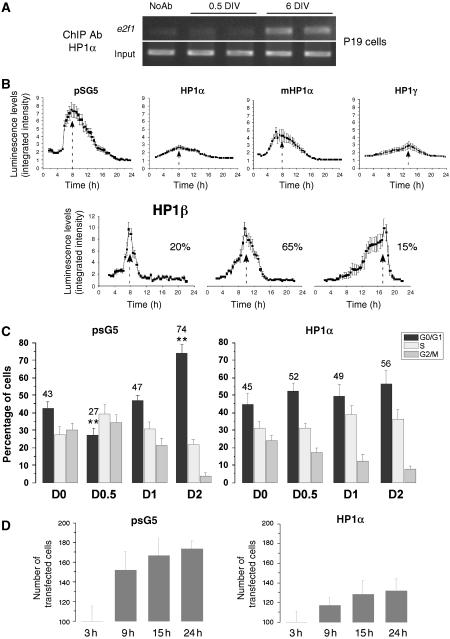
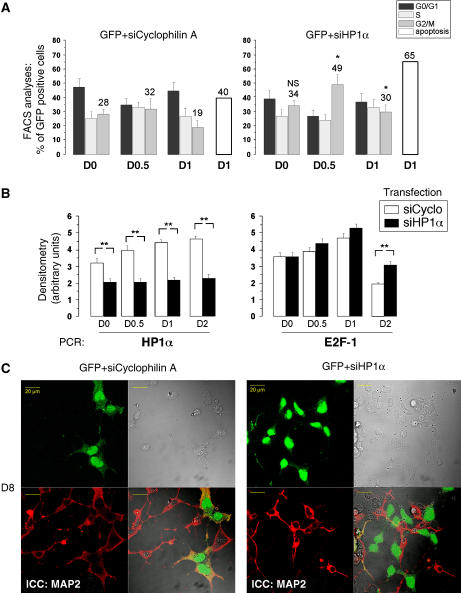
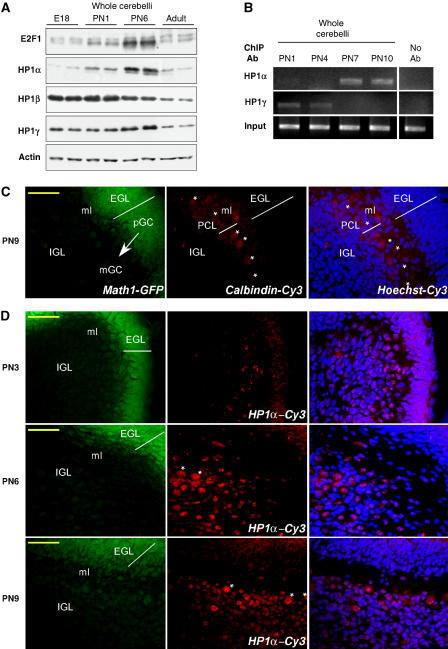
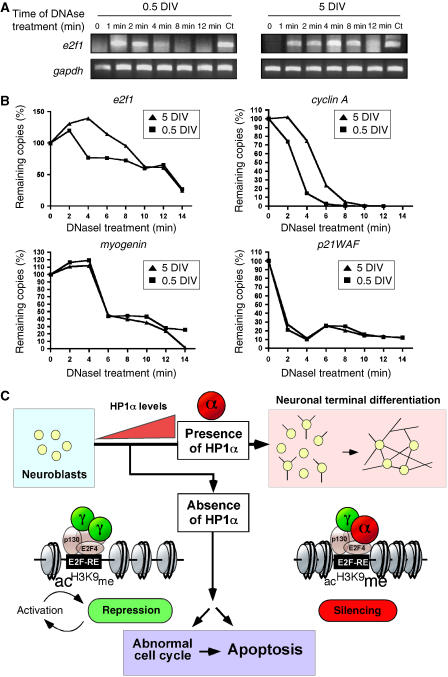
A critical step of neuronal terminal differentiation is the permanent withdrawal from the cell cycle that requires the silencing of genes that drive mitosis. Here, we describe that the alpha isoform of the heterochromatin protein 1 (HP1) protein family exerts such silencing on several E2F-targeted genes. Among the different isoforms, HP1alpha levels progressively increase throughout differentiation and take over HP1gamma binding on E2F sites in mature neurons. When overexpressed, only HP1alpha is able to ensure a timed repression of E2F genes. Specific inhibition of HP1alpha expression drives neuronal progenitors either towards death or cell cycle progression, yet preventing the expression of the neuronal marker microtubule-associated protein 2. Furthermore, we provide evidence that this mechanism occurs in cerebellar granule neurons in vivo, during the postnatal development of the cerebellum. Finally, our results suggest that E2F-targeted genes are packaged into higher-order chromatin structures in mature neurons relative to neuroblasts, likely reflecting a transition from a 'repressed' versus 'silenced' status of these genes. Together, these data present new epigenetic regulations orchestrated by HP1 isoforms, critical for permanent cell cycle exit during neuronal differentiation.


Figures

Figure 1
Figure 1
Synchronous silencing of e2f-targeted genes during NTD. (A) CGN morphology in primary cultures was visualized at different DIV by a MAP2 immunostaining (upper panel). Mitotic activity was evidenced by BrdU incorporation followed by immunodetection (lower panel). (B) Expression of the neuronal markers MAP2 and the L-type voltage-gated calcium channel (vgcc-L) was measured by semiquantitative RT–PCR. Bands were quantified relative to gapdh amounts and results are represented as fold induction. (C) E2F1 protein levels were measured by western blot analyses at different DIV. A typical experiment is shown and quantified (D) Expression of several e2f-targeted genes: e2f1, cyclin E, cyclin A, dhfr, Bmyb was analyzed by semiquantitative RT–PCR. A series of dilutions (1/2 and 1/4) was performed to ensure the linear range of amplification. Experiments have been repeated 3–5 times.
Figure 2
Figure 2
Recruitment of HP1 proteins at E2F sites during NTD. (A) A biotinylated fragment of the mouse e2f1 gene promoter (−63/−6) containing two E2F-RE is bound to Streptavidin MicroBeads (strep.) and retained in the magnetic field. Nuclear extracts from mature neurons (4 DIV) were tested. All fractions obtained from columns were analyzed by western blot (BR, binding reaction, which represents the input material; E, eluate; FT, flow through; W, washes). (B) ChIP assays were performed on CGN at 0.5 and 4 DIV with antibodies against E2F4 and p130. Precipitated DNA were analyzed by semiquantitative PCR with primers to the mouse e2f1 promoter. Control PCR experiments were performed with total DNA (input) and DNA isolated in the absence of primary antibody. (C) Immunoprecipitation experiments were performed on CGN extracts from 0.5 and 4 DIV with antibodies against HP1 proteins and p130 as indicated. Precipitated proteins were analyzed by western blot for p130. mAb and pAb: control IPs performed with, respectively, unrelated monoclonal (actin) and polyclonal (sp4) primary antibodies. (D) In vitro binding assay as in (A), performed with nuclear extracts obtained from mature CGN (4 DIV) or nondifferentiated neurons (0.5 DIV). All fractions were analyzed by western blot for the three different variants of HP1 as noted (W1 and W2: two washes steps). Ct represents total CGN extracts (positive control). (E) Expression of HP1 isoforms were measured at different DIV in cultured CGN by Western blot analyses. Equal loadings were confirmed by actin immunodetection.
Figure 3
Figure 3
HP1α binding is associated with H3K9 methylation and is displaceable by H3K9 hyperacetylation. (A) Schematics of promoters analyzed in these studies. Boxes represent E2F-REs, arrows indicate primer positions. (B) Binding of HP1α during neuronal maturation to e2f1, cyclin A and dhfr gene promoters was measured by ChIP experiments from immature (0.5 DIV) or mature (4 DIV) CGN. Immunoprecipitated DNA were analyzed by semiquantitative PCR. Control PCR experiments were performed with total DNA (input) and DNA isolated in the absence of primary antibody. In1, input DNA at 0.5 DIV; In2, input DNA at 4 DIV. Bands were quantified relative to the corresponding input DNA sample. Promoter occupancy at 0.5 DIV was arbitrary set at 1. *, **, *** when P<0.01, P<0.05, P<0.001. (C) Binding of HP1γ during neuronal maturation to e2f1, cyclin A and dhfr gene promoters was measured by ChIP experiments and quantified as in (B). (D) ChIP experiments were performed and quantified on CGN at 0.5 and 4 DIV with antibodies against histone H3 dimethylated on lysine 9 (H3K9me2) or acetylated on lysine 9 (H3K9ac), as in (B). (E) TSA treatment induced e2f-targeted gene transcription. Semiquantitative PCR were run on total RNA from mature CGN treated with 100 nM TSA for 5 h, for different genes as noted. Bands were quantified relative to gapdh amounts. Histograms represent fold induction relative to nontreated cells arbitrarily set at 1. * when P<0.001. (F) After 4 DIV, CGN were treated with 100 nM of TSA for 5 h or not (Ct). ChIP experiments were performed as described above with H3K9me2 or H3K9ac and HP1α antibodies. Promoter occupancy in control was arbitrarily set at 1. *, *** when P<0.01, P<0.001.
Figure 4
Figure 4
HP1α controls E2F-dependent transcription and the last cell division before P19 embryonic cell differentiation. (A) ChIP experiments were performed on nondifferentiated (0.5 DIV) and differentiated (6 DIV) P19 cells with an HP1α antibody. Control PCR experiments were performed with total DNA (input) and DNA isolated in the absence of primary antibody, no Ab (B) P19 cells were co-transfected with HP1α, HP1α mutated in the chromodomain (mHP1α), HP1β, HP1γ, or the empty pSG5 vector as a control, and the E2F-luc reporter plasmid. Neuronal differentiation was induced 24 h after transfection, using 1 μM RA. Simultaneously, firefly luciferin (Biosynth, Switzerland) was added to the medium and luminescence imaging was carried out. Images were acquired using 30 min integration times. Results are expressed as the integrated intensity of light in the analyzed area. For HP1β, the percentage of cells averaged in the peak is given on the right. (C) Cells were co-transfected with EGFP and HP1α expression vector or the empty pSG5 plasmid as a control and neuronal differentiation was induced 24 h post-transfection. Cell cycle stage was determined by FACS at indicated times after RA treatment. Cell cycle analysis was specifically performed on GFP-expressing cells. One-way ANOVA test followed by Bonferroni means comparison test was performed only for G0/G1 values. For pSG5 transfected cells, ** indicates statistical significance compared with control cells at day 0 (D0). For HP1α-transfected cells, the G0/G1 values for the different time points are not statistically different compared to D0. (D) P19 cells were co-transfected as in C and the number of transfected cells were counted in six different fields for each transfection conditions at indicated time points. The total number of transfected cells counted are represented on the histograms.
Figure 5
Figure 5
HP1α knockdown impairs proper neuronal differentiation and activates e2f-1 expression. P19 cells were co-transfected with pGFP and siRNA directed against cyclophilinA as control or HP1α, 72 h before differentiation induction. (A) Time course analyses of the transfected cell population by FACS. One-way ANOVA test followed by Bonferroni means comparison test was performed. The G2/M values for each time points of siHP1α/GFP-transfected cells were compared to the corresponding times of siCyclophilin A/GFP-transfected cells. * indicates statistical difference compared to control cells with P<0.05 (B). Expressions of e2f1 and hp1α genes in P19 cells transfected with control siRNA against cyclophilin A and HP1α were measured by semiquantitative RT–PCR. Bands were quantified and results are presented as arbitrary units of densitometry. One-way ANOVA test followed by Bonferroni means comparison test was performed. The values for each time points of siHP1α-transfected cells were compared to the corresponding times of siCyclophilin A-transfected cells. ** indicates statistical significance with P<0.01. (C) Immunocytochemistry at day 8 (D8) after differentiation with MAP2 antibody (red) and visualization of GFP-expressing cells (green). The GFP-transfected cells (that previously showed a transient knockdown for HP1α at D1, see Supplementary Figure S3D,E) are not MAP2-positive.
Figure 6
Figure 6
Expression and binding of HP1 proteins in vivo. (A) Cerebelli were dissected at different developmental stages of the mice: embryonic stage 18 (E18), PN1, PN6 and adult (PN50). Western blot analysis was performed with antibodies against E2F1, HP1α, β, γ and actin as indicated. (B) Cerebelli were dissected from mice at PN1, PN4, PN7 and PN10 and ChIP experiments were performed on fresh tissue with antibodies against HP1α or HP1γ with primers specific to the e2f1 gene promoter. Control PCR experiments were performed with total DNA (input) and DNA isolated in the absence of primary antibody, no Ab. A typical experiment is shown. (C) Cerebellar sections from Math1-GFP transgenic mice at PN9 were immunostained for calbindin (middle panel). Most intense GFP was found in the EGL reflecting the normal expression pattern of Math1 in pGC (left panel). An overlay of Hoechst staining and Cy3 immunolabeling is presented on the right panel. The arrow indicates pGC migration through ml to IGL where mGC are localized. Asterisks show single Purkinje cells in PCL. Scale bar 50 μm. (D) Cy3-coupled HP1α immnunostaining was performed on cerebellar sections from Math1-GFP transgenic mice at different PN as noted. Indications are the same as in (C). Note the increased population of HP1α-positive mGC in the IGL at PN6.
Figure 7
Figure 7
Promoter accessibility tested by DNaseI protection assays in CGN. (A, B) A time course of DNaseI sensitivity was assayed on nuclei isolated from 0.5 and 5 DIV neurons at the time indicated (in minutes). Semiquantitative PCR were run to check the presence of different promoters as noted. Equal loadings were confirmed by control PCR with primers against gapdh. A typical experiment is shown for the e2f1 promoter (A) and quantification relative to gapdh amounts is shown for e2f1, cyclin A, myogenin and p21WAF1 promoters (B). (C) A model showing that, in neuroblasts reaching the quiescent state, transcriptional activation/repression of E2F-targeted genes occurs through p130 and E2F4 under HP1γ control. Lysine9 from histone H3 (H3K9) surrounding E2F-RE within promoters are rather acetylated (ac) than methylated (me). During maturation, HP1α levels increase and take control at E2F-REs. H3K9 on E2F promoters become more methylated, bringing a favorable environment to HP1α binding. Effective silencing of E2F-dependent genes thus ensures neuronal survival throughout the differentiation process. In the absence of HP1α, neuroblasts will either enter an abnormal cell cycle and/or die.

Similar articles

Cited by

References

    1. Auth T, Kunkel E, Grummt F (2006) Interaction between HP1alpha and replication proteins in mammalian cells. Exp Cell Res 312: 3349–3359 - PubMed
    1. Badugu R, Yoo Y, Singh PB, Kellum R (2005) Mutations in the heterochromatin protein 1 (HP1) hinge domain affect HP1 protein interactions and chromosomal distribution. Chromosoma 113: 370–384 - PubMed
    1. Bannister AJ, Zegerman P, Partridge JF, Miska EA, Thomas JO, Allshire RC, Kouzarides T (2001) Selective recognition of methylated lysine 9 on histone H3 by the HP1 chromo domain. Nature 410: 120–124 - PubMed
    1. Boutillier AL, Trinh E, Loeffler JP (2002) Constitutive repression of E2F1 transcriptional activity through HDAC proteins is essential for neuronal survival. Ann N Y Acad Sci 973: 438–442 - PubMed
    1. Boutillier AL, Trinh E, Loeffler JP (2003) Selective E2F-dependent gene transcription is controlled by histone deacetylase activity during neuronal apoptosis. J Neurochem 84: 814–828 - PubMed

Publication types

Substances

LinkOut - more resources