. 2007 Sep;18(9):3667-80.
doi: 10.1091/mbc.e06-07-0604. Epub 2007 Jul 11.

Chromatin remodeling proteins interact with pericentrin to regulate centrosome integrity

Affiliations

Chromatin remodeling proteins interact with pericentrin to regulate centrosome integrity

James Edward Sillibourne et al. Mol Biol Cell. 2007 Sep.

Abstract

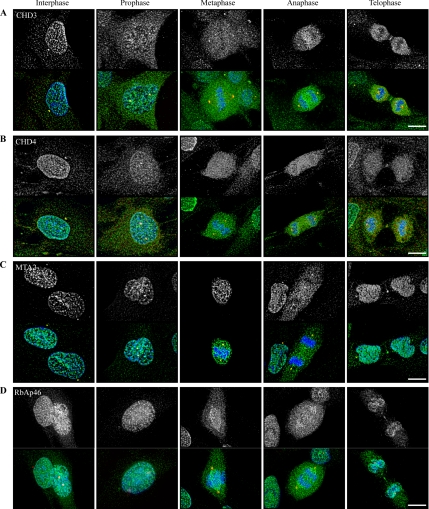
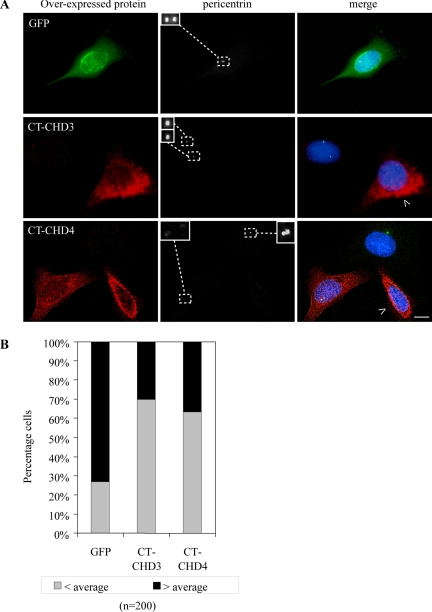
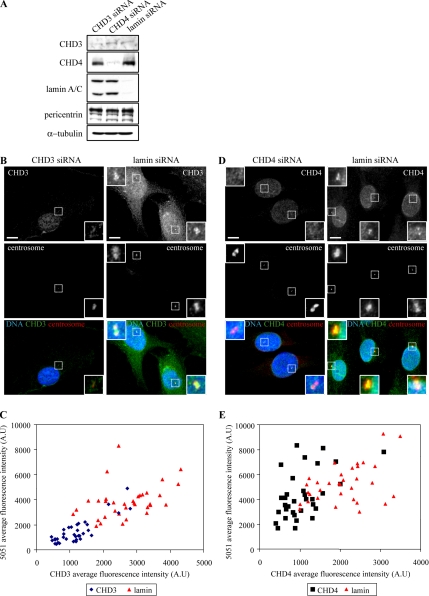
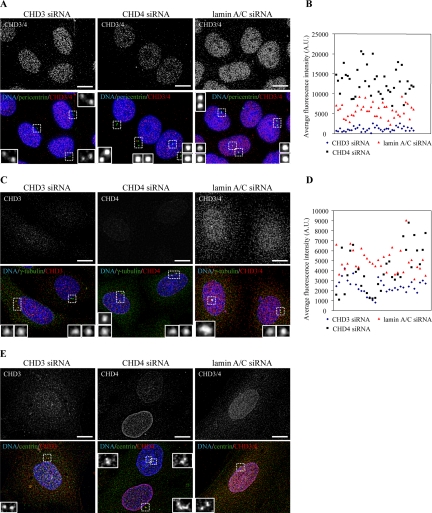
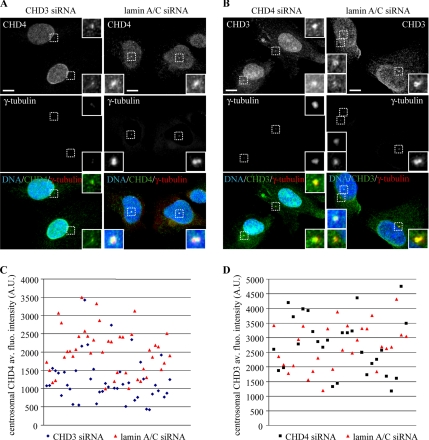
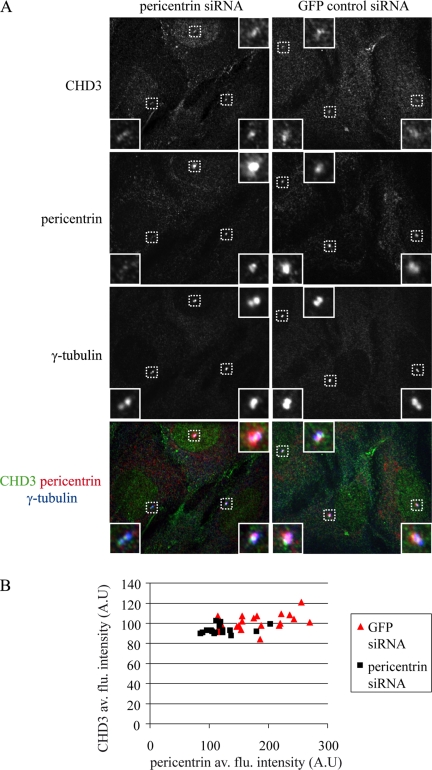
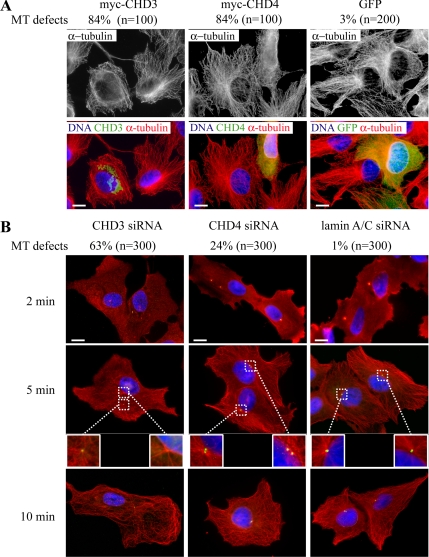
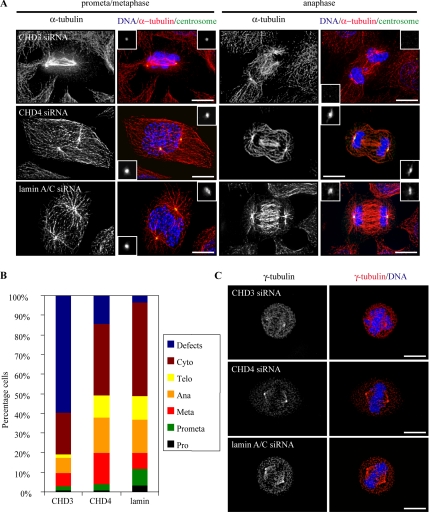
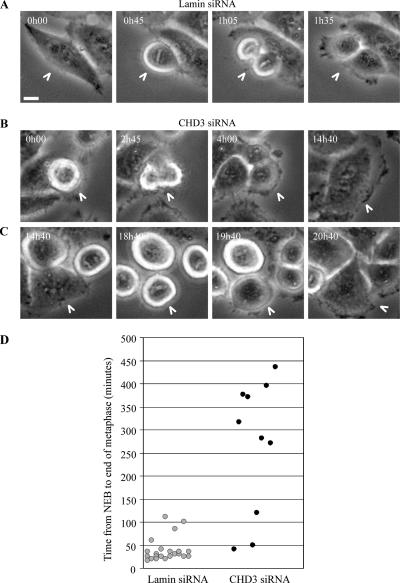
Pericentrin is an integral centrosomal component that anchors regulatory and structural molecules to centrosomes. In a yeast two-hybrid screen with pericentrin we identified chromodomain helicase DNA-binding protein 4 (CHD4/Mi2beta). CHD4 is part of the multiprotein nucleosome remodeling deacetylase (NuRD) complex. We show that many NuRD components interacted with pericentrin by coimmunoprecipitation and that they localized to centrosomes and midbodies. Overexpression of the pericentrin-binding domain of CHD4 or another family member (CHD3) dissociated pericentrin from centrosomes. Depletion of CHD3, but not CHD4, by RNA interference dissociated pericentrin and gamma-tubulin from centrosomes. Microtubule nucleation/organization, cell morphology, and nuclear centration were disrupted in CHD3-depleted cells. Spindles were disorganized, the majority showing a prometaphase-like configuration. Time-lapse imaging revealed mitotic failure before chromosome segregation and cytokinesis failure. We conclude that pericentrin forms complexes with CHD3 and CHD4, but a distinct CHD3-pericentrin complex is required for centrosomal anchoring of pericentrin/gamma-tubulin and for centrosome integrity.


Figures

Figure 1.
Figure 1.
Components of the NuRD complex interact with pericentrin. (A) Yeast strain AH109, transformed with the C terminus of either CHD3 (residues 1566-1966) or CHD4 (residues 1577-1912) and a C-terminal (C-ter) region of pericentrin A (peri; residues 1340-1756) grown on selective media to demonstrate interactions (DBD, DNA binding domain; TAD, transactivation domain). (B) COS cells cotransfected with HA-pericentrin (HA-peri) and FLAG-CHD4 expression constructs. Anti-FLAG or anti-GFP (control; Con) were used for immunoprecipitations (IPs). IPs were immunoblotted (IB) with antibodies as indicated. (C) CoIP of endogenous pericentrin with FLAG-CHD4 from transfected COS cell lysates. (D) Immunoblots with antibodies to CHD3, CHD4, MTA2, RpAp46, MBD3, and FLAG after IP of FLAG-tagged pericentrin expressed in COS cells. (E) CHD3/4 was immunoprecipitated from HeLa cell lysates and immunoblotted for pericentrin or CHD3/4.
Figure 2.
Figure 2.
NuRD components localize to centrosomes and midbodies. (A–D) RPE-1 cells at the indicated cell cycle stages were stained with antibodies against the NuRD components CHD3 (A), CHD4 (B), MTA2 (C), and RbAp46 (D) (green), a centrosomal marker (γ-tubulin or human autoimmune serum 5051; red) and DAPI (DNA; blue). Antibodies to all NuRD components except RbAp46 stained centrosomes of interphasic cells. CHD3 and MTA2 centrosomal staining was observed at all mitotic stages, whereas CHD4 seem to dissociate from the centrosome during mitosis. Central spindle and midbody staining during anaphase and telophase was also observed. Bars, 10 μm.
Figure 3.
Figure 3.
Overexpression of the C terminus (CT) of CHD3 or CHD3 induces loss of pericentrin from centrosomes in interphase cells. (A) HeLa cells electroporated with myc-tag constructs expressing the C terminus of CHD3 or CHD4 or a control plasmid (GFP), plated onto fibronectin/collagen-coated coverslips, fixed in −20°C methanol 6 h later, and stained with anti-myc to detect overexpressed protein (red) or pericentrin (green) with the exception of GFP control where transfected cells were stained with an anti-pericentrin antibody and a Cy3 secondary (red). In most cases, pericentrin was either undetectable (at arrowheads) or reduced at centrosomes (boxes) in cells expressing CT-CHD3 or CT-CHD4 compared with control GFP-expressing cells (row 1) or nontransfected cells (column 2). In some cases, overexpressed CT-CHD4 localized to the centrosome (left cell). Insets show enlargements of boxes. (B) Quantification of results from A show that ∼70% of CT-CHD3/4-expressing cells have barely detectable pericentrin with centrosomal levels being 50% lower than the average (< average). The remainder possessed more than 50% of the average centrosomal pericentrin level (> average). Bar, 10 μm.
Figure 4.
Figure 4.
RNAi-mediated depletion of CHD3 but not CHD4 disrupts centrosome integrity. (A) RPE-1 cells treated with siRNAs targeting CHD3, CHD4 or lamin (control) for 72 h were lysed and IB for the indicated proteins. Note specific reduction of the targeted protein, but not others. Pericentrin levels unaffected under all conditions. (B and C) Cells treated with siRNAs targeting CHD3, CHD4, or lamin A/C were fixed in −20°C methanol and stained with antibodies to CHD3, CHD4, or 5051 (centrosome marker). In many cells (∼80%), CHD3 and CHD4 were depleted from nuclei and centrosomes. In cells depleted of CHD3, a decrease in 5051 autoantibody staining was observed (B, middle image of left column), suggesting a loss of many of the proteins known to react with this human autoimmune serum. In contrast, depletion of CHD4 did not show significant loss of 5051 staining (C, middle image of left column). (D and E) Results of fluorescence intensity measurements plotting centrosomal 5051 levels against those of CHD3 or CHD4. After siRNA-mediated silencing of the CHD3 gene, both CHD3 and 5051 levels were reduced compared with lamin A/C siRNA-treated control cells (average CHD3 levels after CHD3 RNAi, 1182.9 arbitrary units (a.u.); lamin A/C RNAi, 2715.3 a.u; average 5051 levels after CHD3 RNAi, 1433.7 a.u; lamin A/C RNAi, 3834.0 a.u.). A slight reduction in the level of centrosomal 5051 was observed after treatment with CHD4 siRNA (average CHD4 levels after CHD4 RNAi, 1050.1 a.u.; lamin A/C RNAi, 2070.8 a.u.; average 5051 levels after CHD4 RNAi, 4343.7 a.u.; lamin A/C RNAi, 5256.2 a.u.). Bars, 10 μm.
Figure 5.
Figure 5.
CHD3 depletion reduces centrosomal levels of pericentrin and γ-tubulin but not centrin. (A) HeLa cells treated with siRNAs against CHD3, CHD4, or lamin A/C (control) for 48 h were fixed in −20°C methanol and stained with antibodies to CHD3/4 (red) and pericentrin (green). Silencing of CHD3 (left) but not CHD4 or lamin (middle and right) induced loss of centrosomal pericentrin. (B) Results of fluorescent intensity measurements quantifying pericentrin levels showed that CHD3 RNAi induced a loss of pericentrin from the centrosome (p < 0.001), whereas levels were elevated after CHD4 RNAi (p < 0.001). Average centrosomal pericentrin levels were as follows: after CHD3 RNAi, 1142.9 a.u.; CHD4 RNAi, 12,964.1 a.u.; and lamin A/C RNAi 5784.6 a.u. (C) HeLa siRNA-treated cells from experiment in A were stained with antibodies to CHD3 or CHD4 (red) and γ-tubulin (green). Insets show enlarged images of centrosomal γ-tubulin. (D) Centrosomal γ-tubulin levels were quantified by taking fluorescence intensity measurements and found to be significantly reduced after CHD3 RNAi (p < 0.001). The γ-tubulin levels were only slightly reduced after CHD4 RNAi (p < 0.05 marginally significant). Average γ-tubulin levels were as follows: after CHD3 RNAi, 2408.7 a.u.; CHD4 RNAi, 4118.6 a.u., and lamin A/C RNAi, 4904.4 a.u. (E) RPE-1 cells treated with siRNAs as in A for 72 h were fixed and stained with antibodies to CHD3 or CHD4 (red) and centrin-1 (green) to label centrioles. Insets show enlarged images of centrin-1 staining, which was similar under all conditions. Bars, 10 μm.
Figure 6.
Figure 6.
Anchoring of CHD4 to the centrosome is dependent upon CHD3. (A and B) RPE-1 cells were treated with siRNA against CHD3, CHD4, or lamin A/C for 72 h, fixed, and stained with either anti-CHD4 (A) or anti-CHD3 (B) and anti-γ-tubulin antibodies. (C) Fluorescence intensity measurements showed that silencing of the CHD3 gene resulted in a significant reduction in the amount of CHD4 at the centrosome (p < 0.001), but they did not seem to affect the nuclear pool of this protein. The average level of centrosomal CHD4 in lamin A/C control RNAi-treated cells was 2024.7 a.u. compared with 1234.5 a.u. in CHD3 RNAi-treated cells. (D) Cells treated with siRNA against CHD4 still possessed CHD3 at the centrosome with levels remaining unchanged compared with lamin A/C siRNA-treated controls (p > = 0.05). The average fluorescence intensities were 2756.0 a.u. and 2715.2 a.u. for CHD4 and lamin A/C siRNA-treated cells, respectively. Bars, 10 μm.
Figure 7.
Figure 7.
Pericentrin is not required for CHD3 centrosomal localization. (A) RPE-1 cells were treated with siRNA against pericentrin or GFP for 72 h, fixed, and stained with anti-CHD3 (green), anti-pericentrin (red) and anti-γ-tubulin (blue) antibodies. Insets show enlargements of the centrosomal areas marked with boxes. Depletion of pericentrin did not significantly alter the localization of CHD3 to the centrosome. (B) Quantification of pericentrin and CHD3 levels at the centrosome by measuring fluorescence intensity. Pericentrin levels were reduced upon RNAi, but CHD3 levels remained virtually unchanged. Bars, 10 μm.
Figure 8.
Figure 8.
Microtubule organization and nucleation is diminished in cells overexpressing or depleted of CHD3. (A) RPE-1 cells were electroporated with myc-tagged CHD3 or CHD4 C terminus or GFP as a control. Cells were fixed 6 h after transfection and stained with anti-α-tubulin and anti-myc antibodies. Cells transfected with either the C terminus of CHD3 or CHD4 possessed fewer and more disorganized microtubule arrays compared with GFP controls with 84%, in each case, exhibiting the phenotype shown. In contrast only 3% of GFP-transfected cells had a disorganized microtubule array. (B) Time course of microtubule regrowth. Cells depleted of CHD3, CHD4, or lamin (control) for 40 h were treated with nocodazole for 90 min; washed free of drug; fixed at 2-, 5-, and 10-min time intervals; and stained for microtubules (red), centrosomes (5051 autoimmune serum; green) and DNA (blue). Note fewer centrosome-nucleated microtubules (column 1, middle) and the curved, unfocused microtubules (column 1, bottom). One microtubule aster (right box, first column) is not associated with a centrosome. Percentages refer to number of cells having disrupted microtubule arrays. Bars 10 μm.
Figure 9.
Figure 9.
CHD3 depletion induces mitotic spindle defects. (A) HeLa cells treated with the indicated siRNAs for 48 h were fixed with −20°C methanol and stained with anti-α-tubulin (red) and 5051 (green, centrosomes) antibodies. CHD3 depletion (top) resulted in poorly organized spindles, misaligned chromosomes, and bundled microtubules compared with CHD4 and lamin A/C siRNA-treated cells (bottom). Also see Supplemental Figure 2. Insets, 5051-labeled centrosomes. (B) Quantification of spindle defects in siRNA-treated cells. Defects, which include abnormal prometaphase-like phenotype (specific for CHD3), monopolar-, tripolar-, and half-spindles and spindles with lagging chromosomes, are ∼60% in CHD3-depleted cells. Other categories indicate the percentage of cells in each phase of mitosis that seem to be undergoing normal division (cyto, cytokinesis; telo, telophase; ana, anaphase; meta, metaphase; prometa; prometaphase; and pro, prophase). n = 100–200 mitotic cells counted for each condition. (C) γ-Tubulin staining in CHD3-depleted mitotic HeLa cells was reduced on poles and spindles and increased in the cytoplasm when compared with CHD4- and lamin AC-depleted cells. Bars, 10 μm.
Figure 10.
Figure 10.
CHD3 depletion causes metaphase delay, mitotic failure, and cytokinesis defects. Still images from time-lapse movies (see Supplemental Movies) of HeLa cells depleted of lamin A/C (A, control) or CHD3 (B and C). Image collection was initiated 24 h after siRNA treatment and continued for >22 h. (A) Successful mitosis in lamin A/C-depleted cell. (B) Mitotic CHD3-depleted cell (time 0 h 00 min) enters anaphase (2 h 45 min) and seems to complete telophase (4 h 00 min), but ultimately it fails cytokinesis to become a binucleated cell (14 h 40 min). (C) Another CHD3-depleted cell (arrowhead) enters metaphase (18 h 40 min) and exits mitosis without dividing (20 h 40 min). (D) Graph showing timing of individual cells from nuclear envelope breakdown (NEB) to anaphase onset: ∼38 min in lamin A/C-depleted cells (range 15–110 min) and 265 min in CHD3-depleted cells (range 40–435 min). Bar, 10 μm.

Similar articles

Cited by

References

    1. Araki M., Masutani C., Takemura M., Uchida A., Sugasawa K., Kondoh J., Ohkuma Y., Hanaoka F. Centrosome protein centrin 2/caltractin 1 is part of the xeroderma pigmentosum group C complex that initiates global genome nucleotide excision repair. J. Biol. Chem. 2001;276:18665–18672. - PubMed
    1. Aubry F., Mattei M. G., Galibert F. Identification of a human 17p-located cDNA encoding a protein of the Snf2-like helicase family. Eur. J. Biochem. 1998;254:558–564. - PubMed
    1. Bowen N. J., Fujita N., Kajita M., Wade P. A. Mi-2/NuRD: multiple complexes for many purposes. Biochim. Biophys. Acta. 2004;1677:52–57. - PubMed
    1. Brehm A., Tufteland K. R., Aasland R., Becker P. B. The many colours of chromodomains. Bioessays. 2004;26:133–140. - PubMed
    1. Chadwick B. P., Willard H. F. Cell cycle-dependent localization of macroH2A in chromatin of the inactive X chromosome. J. Cell Biol. 2002;157:1113–1123. - PMC - PubMed

Publication types

MeSH terms