

Quaternary structures of tumor suppressor p53 and a specific p53 DNA complex
- PMID: 17620598
- PMCID: PMC1941468
- DOI: 10.1073/pnas.0705069104
Quaternary structures of tumor suppressor p53 and a specific p53 DNA complex
Abstract
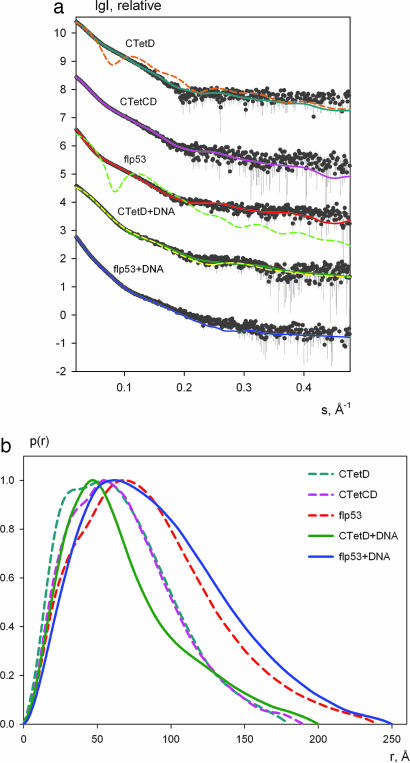
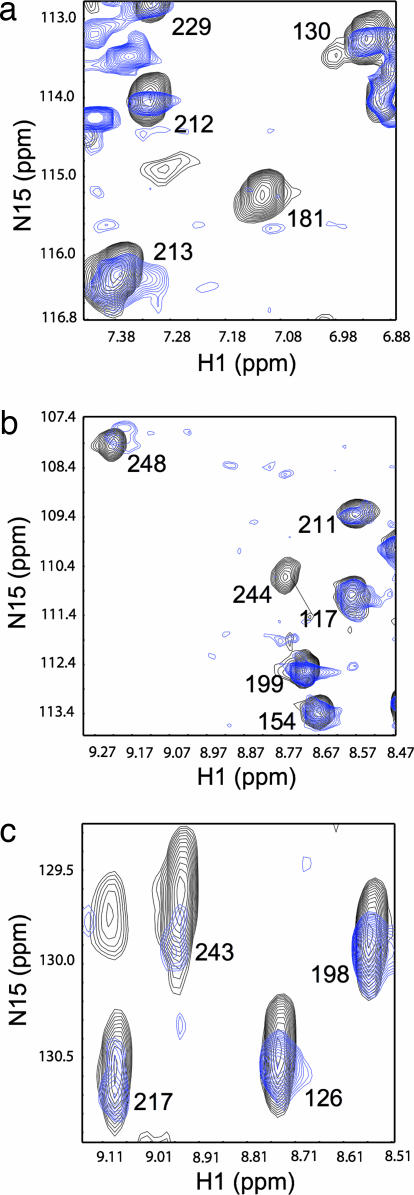
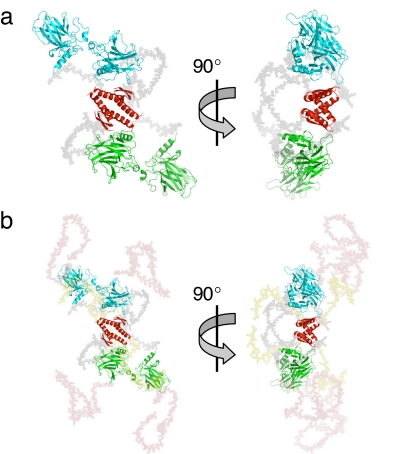
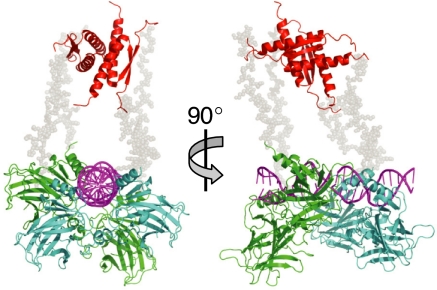
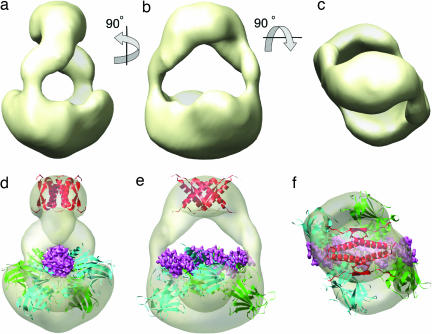
The homotetrameric tumor suppressor p53 consists of folded core and tetramerization domains, linked and flanked by intrinsically disordered segments that impede structure analysis by x-ray crystallography and NMR. Here, we solved the quaternary structure of human p53 in solution by a combination of small-angle x-ray scattering, which defined its shape, and NMR, which identified the core domain interfaces and showed that the folded domains had the same structure in the intact protein as in fragments. We combined the solution data with electron microscopy on immobilized samples that provided medium resolution 3D maps. Ab initio and rigid body modeling of scattering data revealed an elongated cross-shaped structure with a pair of loosely coupled core domain dimers at the ends, which are accessible for binding to DNA and partner proteins. The core domains in that open conformation closed around a specific DNA response element to form a compact complex whose structure was independently determined by electron microscopy. The structure of the DNA complex is consistent with that of the complex of four separate core domains and response element fragments solved by x-ray crystallography and contacts identified by NMR. Electron microscopy on the conformationally mobile, unbound p53 selected a minor compact conformation, which resembled the closed conformation, from the ensemble of predominantly open conformations. A multipronged structural approach could be generally useful for the structural characterization of the rapidly growing number of multidomain proteins with intrinsically disordered regions.
Conflict of interest statement
The authors declare no conflict of interest.
Figures
Comment in
-
Quaternary structure of p53: the light at the end of the tunnel.Proc Natl Acad Sci U S A. 2007 Jul 24;104(30):12231-2. doi: 10.1073/pnas.0705319104. Epub 2007 Jul 18. Proc Natl Acad Sci U S A. 2007. PMID: 17640907 Free PMC article. No abstract available.
Similar articles
-
Multiple conformations of full-length p53 detected with single-molecule fluorescence resonance energy transfer.Proc Natl Acad Sci U S A. 2009 Dec 8;106(49):20758-63. doi: 10.1073/pnas.0909644106. Epub 2009 Nov 20. Proc Natl Acad Sci U S A. 2009. PMID: 19933326 Free PMC article.
-
Domain-domain interactions in full-length p53 and a specific DNA complex probed by methyl NMR spectroscopy.Proc Natl Acad Sci U S A. 2012 Sep 25;109(39):15752-6. doi: 10.1073/pnas.1214176109. Epub 2012 Sep 12. Proc Natl Acad Sci U S A. 2012. PMID: 22972749 Free PMC article.
-
Structure of tumor suppressor p53 and its intrinsically disordered N-terminal transactivation domain.Proc Natl Acad Sci U S A. 2008 Apr 15;105(15):5762-7. doi: 10.1073/pnas.0801353105. Epub 2008 Apr 7. Proc Natl Acad Sci U S A. 2008. PMID: 18391200 Free PMC article.
-
Structural biology of the p53 tumour suppressor.Curr Opin Struct Biol. 2009 Apr;19(2):197-202. doi: 10.1016/j.sbi.2009.02.003. Epub 2009 Mar 13. Curr Opin Struct Biol. 2009. PMID: 19286366 Review.
-
Structural and sequential context of p53: A review of experimental and theoretical evidence.Prog Biophys Mol Biol. 2015 Mar;117(2-3):250-263. doi: 10.1016/j.pbiomolbio.2014.12.002. Epub 2014 Dec 27. Prog Biophys Mol Biol. 2015. PMID: 25550083 Review.
Cited by
-
p53 sumoylation: mechanistic insights from reconstitution studies.Epigenetics. 2009 Oct 1;4(7):445-51. doi: 10.4161/epi.4.7.10030. Epub 2009 Oct 9. Epigenetics. 2009. PMID: 19838051 Free PMC article.
-
Quaternary structure of p53: the light at the end of the tunnel.Proc Natl Acad Sci U S A. 2007 Jul 24;104(30):12231-2. doi: 10.1073/pnas.0705319104. Epub 2007 Jul 18. Proc Natl Acad Sci U S A. 2007. PMID: 17640907 Free PMC article. No abstract available.
-
Cooperativity dominates the genomic organization of p53-response elements: a mechanistic view.PLoS Comput Biol. 2009 Jul;5(7):e1000448. doi: 10.1371/journal.pcbi.1000448. Epub 2009 Jul 24. PLoS Comput Biol. 2009. PMID: 19629163 Free PMC article.
-
Aggregation and Prion-Like Properties of Misfolded Tumor Suppressors: Is Cancer a Prion Disease?Cold Spring Harb Perspect Biol. 2016 Oct 3;8(10):a023614. doi: 10.1101/cshperspect.a023614. Cold Spring Harb Perspect Biol. 2016. PMID: 27549118 Free PMC article. Review.
-
The butyrylcholinesterase K variant confers structurally derived risks for Alzheimer pathology.J Biol Chem. 2009 Jun 19;284(25):17170-17179. doi: 10.1074/jbc.M109.004952. Epub 2009 Apr 21. J Biol Chem. 2009. PMID: 19383604 Free PMC article.
References
-
- Hainaut P, Wiman KG, editors. 25 Years of p53 Research. New York: Springer; 2005.
-
- Vogelstein B, Lane D, Levine AJ. Nature. 2000;408:307–310. - PubMed
-
- Hupp TR, Lane DP. Cold Spring Harbor Symp Quant Biol. 1994;59:195–206. - PubMed
-
- Hupp TR, Sparks A, Lane DP. Cell. 1995;83:237–245. - PubMed
-
- Dawson R, Muller L, Dehner A, Klein C, Kessler H, Buchner J. J Mol Biol. 2003;332:1131–1141. - PubMed
Publication types
MeSH terms
Substances
Grants and funding
LinkOut - more resources
Full Text Sources
Molecular Biology Databases
Research Materials
Miscellaneous
