. 2007 Aug;171(2):513-24.
doi: 10.2353/ajpath.2007.070188. Epub 2007 Jul 9.

Linking of autophagy to ubiquitin-proteasome system is important for the regulation of endoplasmic reticulum stress and cell viability

Affiliations

Linking of autophagy to ubiquitin-proteasome system is important for the regulation of endoplasmic reticulum stress and cell viability

Wen-Xing Ding et al. Am J Pathol. 2007 Aug.

Abstract

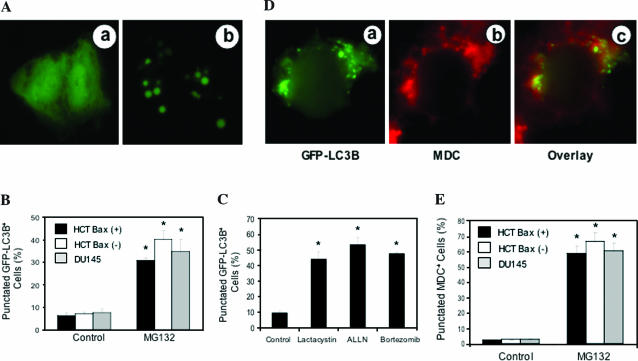
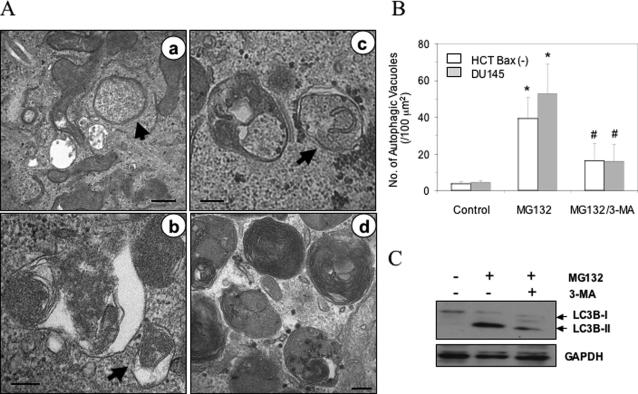
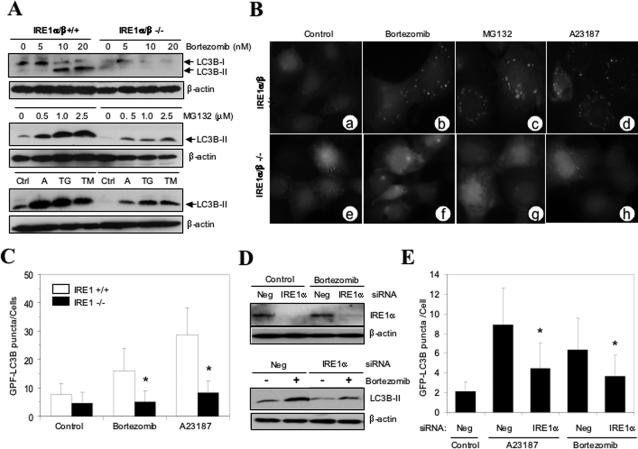
Two major protein degradation systems exist in cells, the ubiquitin proteasome system and the autophagy machinery. Here, we investigated the functional relationship of the two systems and the underlying mechanisms. Proteasome inhibition activated autophagy, suggesting that the two are functionally coupled. Autophagy played a compensatory role as suppression of autophagy promoted the accumulation of polyubiquitinated protein aggregates. Autophagy was likely activated in response to endoplasmic reticulum stress caused by misfolded proteins during proteasome inhibition. Suppression of a major unfolded protein response pathway mediated by IRE1 by either gene deletion or RNA interference dramatically suppressed the activation of autophagy by proteasome inhibitors. Interestingly, c-Jun NH(2)-terminal kinase (JNK) but not XBP-1, both of which are the known downstream targets of IRE1, seemed to participate in autophagy induction by proteasome inhibitors. Finally, proteasome inhibitor-induced autophagy was important for controlling endoplasmic reticulum stress and reducing cell death in cancer cells. Our studies thus provide a mechanistic view and elucidate the functional significance of the link between the two protein degradation systems.


Figures

Figure 1
Figure 1
Proteasome inhibition leads to accumulation of LC3B-II. A and B: Bax-positive and -deficient HCT 116 cells were treated with MG132 (1 μΜ) for different times (A) or at different doses for 16 hours (B). Total lysates were prepared and subjected to immunoblot analysis. Atg5 was detected as the complex with Atg12. C: Bax-deficient HCT 116 cells were treated with lactacystin (5 μmol/L), ALLN (10 μmol/L), or bortezomib (20 nmol/L) for 24 hours, and immunoblot analysis was conducted as above. D: DU145 cells were treated with MG132 (5 μmol/L) for different times and immunoblot analysis was conducted as above. E: Bax-deficient HCT 116 cells were treated with bortezomib (20 nmol/L) in the presence or absence of chloroquine (CQ, 2 μmol/L) for 24 hours. Immunoblot assay was then conducted as indicated.
Figure 2
Figure 2
Membrane translocation of GFP-LC3B in response to proteasome inhibition. A: DU145 cells were transfected with GFP-LC3B, treated with vehicle control (a) or MG132 (5 μmol/L, b) for 24 hours and then examined by fluorescence microscopy. B: Quantification of punctated GFP-LC3B-positive HCT 116 (black column), Bax-deficient HCT 116 (white column), and DU145 (gray column) cells following the treatment with MG132 (mean ± SD). C: HCT116-Bax-deficient cells stably expressing GFP-LC3B were treated with vehicle control, lactacystin (5 μmol/L), ALLN (10 μmol/L), or bortezomib (20 nmol/L) for 24 hours. Percentages of cells with punctated GFP-LC3B signals were determined (mean ± SD). D: Bax-positive HCT 116 cells were transfected with GFP-LC3B, treated with MG132 (1 μmol/L) for 24 hours, and then stained with MDC (200 μmol/L), followed by fluorescence microscopy. E: Quantification of punctated MDC-positive cells in Bax-positive HCT 116 (black column), Bax-deficient HCT 116 (white column), and DU145 (gray column) cells treated with MG132. *P < 0.01 by Z-test between the control and the treated groups.
Figure 3
Figure 3
Electron microscopic detection of autophagic vacuoles in proteasome inhibitor-treated cells. A: Electron micrographs of HCT 116 cells (a and b) and DU145 cells (c and d) treated with MG132 (0.1 to 0.5 μmol/L) for 16 hours. Note the double membrane (a, arrow) or the multimembrane (d) structure of the AVs. Arrows also indicate AVs with the contents of cytosol (a), mitochondria (b), or ER (c). Scale bars: 0.5 μm (a), 0.2 μm (b), 0.25 μm (c), and 0.1 μm (d). B: The number of AVs per 100 μm2 of cytoplasm area (means ± SD) was quantified in Bax-deficient HCT 116 (white column) and DU145 (gray column) cells treated with MG132 (0.1 and 0.25 μmol/L, respectively) in the presence or absence of 3-MA (10 mmol/L). * and #P < 0.01 (*MG132-treated group versus the control; #MG132 plus 3-MA versus MG132 alone) by one-way analysis of variance. C: Bax-deficient HCT 116 cells were treated with MG132 (0.5 μmol/L) plus or minus 3-MA (10 mmol/L), and the processing of LC3B was examined by immunoblot analysis.
Figure 4
Figure 4
Suppression of autophagy enhances proteasome inhibitor-induced cell death in cancer cells. A: Bax-positive and Bax-deficient HCT 116 cells were treated with MG132 in the presence (closed column) or absence (open column) of 3-MA (10 mmol/L) for 24 hours and then stained with Hoechst 33328. Cells with apoptotic nuclear features were defined as apoptotic cells. *P < 0.01 and $P < 0.05 by Z-test between groups without 3-MA and groups with 3-MA for each MG132 dosage and cell line. B: Bax-deficient HCT 116 and DU145 cells were transfected with indicated siRNA against specific Atg genes (target) or a negative control siRNA (Ctrl) for 48 hours followed by immunoblot with different antibodies. Atg5 was detected as the complex with Atg12. C: Bax-deficient HCT 116 (white column) and DU145 (gray column) cells were transfected with 120 nmol/L siRNA against Atg8/LC3B or a negative control siRNA for 36 hours before being treated with MG132. The number of AVs per 100 μm2 of cytoplasm area (means ± SD) was then quantified. * and #P < 0.01 by one-way analysis of variance for both cell lines (*MG132 plus negative siRNA versus the control; #MG132 plus siRNA-LC3B versus MG132 plus negative siRNA). D and E: Bax-deficient HCT 116 cells were transfected with specific siRNA or a negative control (Neg) as indicated and treated with MG132 (0.25 μmol/L) for 16 hours. Apoptotic cells (D) were determined as in A. *P < 0.01 by Z-test (MG132 plus specific siRNA versus MG132 plus negative siRNA). Effector caspase activities (E) were measured using DEVD-AFC as the substrate, and the results were expressed as the fold increase over the nontreated control group.
Figure 5
Figure 5
Suppression of autophagy enhances accumulation of ubiquitinated proteins and aggregates in cancer cells. A: Bax-deficient HCT 116 cells were transfected with negative siRNA (Neg) or siRNA against Atg8/LC3B or Atg6 for 48 hours and then treated with MG132 (0.5 μmol/L) or with control vehicles for 24 hours. Lysates were prepared in radioimmunoprecipitation assay buffer and separated on sodium dodecyl sulfate-polyacrylamide gel electrophoresis. Immunoblot assay was conducted with the anti-ubiquitin (top panels) and anti-β-actin (bottom panels) antibodies. B and C: HCT 116 Bax-deficient cells were transfected with designated siRNA and treated with MG132 (0.5 μmol/L) for 24 hours (B) or as indicated (C). Cells were then fixed with 4% paraformaldehyde and stained with the anti-ubiquitin antibody and the DNA dye Hoechst 33342. Dispersed ubiquitinated proteins could be detected in the nucleus of nontreated cells, but the perinuclear ubiquitinated protein aggregates could be only detected in MG132-treated cells (arrows). The latter (aggresome-positive cells) were quantified and expressed as the percentage of total anti-ubiquitin-positive cells (C). *P < 0.01 and $P < 0.05 by Z-test (specific siRNA versus negative siRNA). D: DU145 cells stably expressing GFP-LC3B were treated with bortezomib (10 nmol/L) for 24 hours and then immunostained with an anti-ubiquitin antibody as well as Hoechst 33342 as above. Cells were then subjected to confocal microscopy. a shows the GFP-LC3B puncta, whereas b shows the ubiquitin-positive aggresomes. Merged image in c indicates the colocalization of GFP-LC3B puncta and the aggresomes.
Figure 6
Figure 6
Suppression of autophagy enhances proteasome inhibitor-induced ER stress in cancer cells. A: Bax-positive (a–c, e–g) and Bax-deficient (d and h) HCT 116 cells were treated with MG132 (1 μmol/L) in the presence or absence of z-VAD (50 μmol/L) as indicated and analyzed 24 hours later by phase microscopy (a–d) and Hoechst staining (e–h). Arrows indicate the apoptotic cells (f), which were greatly reduced in the presence of z-VAD (g) or in the absence of Bax (h). Note that cellular vacuolization was not affected by z-VAD or Bax. B: Bax-deficient HCT 116 or DU145 cells were transfected with siRNA against the indicated Atg genes or a negative control siRNA (Neg) for 48 hours before they were treated with MG132 (0.25 or 0.5 μmol/L, respectively). Percentage of vacuolated cells was quantified 24 hours later. * and #P < 0.01; $P < 0.05 by Z-test (MG132 plus specific siRNA versus MG132 plus negative siRNA in each cell line. * and $HCT 116 cells; #DU145 cells). C: HCT 116 Bax-negative cells were treated with lactacystin (5 μmol/L), ALLN (10 μmol/L), or bortezomib (20 nmol/L) for 24 hours in the presence (closed column) or absence (open column) of 3-MA (10 mmol/L). Percentage of cells with vacuoles was determined. *P < 0.01 by Z-test (groups without 3-MA versus groups with 3-MA for each proteasome inhibitor). D: Bax-deficient HCT 116 cells were treated with vehicle control (a) or MG132 (1 μmol/L b) for 24 hours followed by immunostaining with an anti-calnexin antibody. E: DU145 (a and b) or Bax-deficient HCT 116 cells (c and d) were treated with MG132 (1 or 5 μmol/L, respectively) for 24 hours and then analyzed by electron microscopy. Representative images are shown to indicate the progressive dilation of the ER lumen. The boxed area in a is enlarged in b. Arrows indicate the dilated segment of selected ER (b). Scale bars: 0.25 μm (a and b), 2 μm (c and d). N, nucleus. F: HCT 116 cells were treated with MG132 (1 μmol/L) for indicated times followed by immunoblot analysis. G: Bax-deficient HCT 116 (a and b) and DU145 (c and d) cells were transfected with siRNA against Atg8/LC3B (b and d) or a negative siRNA (a and c) for 36 hours before they were treated with MG132 (0.1 or 0.25 μmol/L, respectively) for 16 hours. Representative electron micrographs are shown to indicate the suppression of autophagy and the enhancement of ER dilation in Atg8/LC3B-knocked-down cells (b and d). N, nucleus; black arrows, autophagic vacuoles; white arrows, nondilated ER. Scale bar = 1 μm. H: Bax-deficient HCT 116 cells were transfected with the indicated siRNA and treated with MG132 as in F. Total cell lysates were prepared, and caspase-4 activity was measured using Ac-LEVD-AFC as the substrate. The results were expressed as the fold of increase over the nontreated control group.
Figure 7
Figure 7
IRE1 is critically involved in proteasome inhibitor-induced autophagy. A: Wild-type and IRE1α/β-deficient MEFs were treated with bortezomib or MG132 at the designated concentrations or with the ER stress inducers A23187 (A, 2.5 μmol/L), thapsigargin (TG, 0.5 μmol/L), or tunicamycin (TM, 5 μg/ml) for 24 hours. Immunoblot assays were then conducted. B and C: Wild-type and IRE1α/β-deficient MEFs expressing GFP-LC3B were treated with vehicle control, bortezomib (10 nmol/L), MG132 (1 μmol/L), or A23187 (2.5 μmol/L) for 24 hours. The punctation of GFP-LC3B was assessed (B). The number of puncta per cell (mean ± SD) was quantified (C). *P < 0.01 by one-way analysis of variance (IRE1α/β-deficient MEFs versus IRE1α/β-positive MEFs). D and E: HCT 116 Bax-deficient cells were transfected with a specific siRNA against IRE1α or a negative control (Neg) siRNA for 24 to 48 hours. They were treated with bortezomib (10 nmol/L) or A23187 (2.5 μmol/L) for an additional 18 to 24 hours. Immunoblot assays were then conducted (D). Alternatively, the extent of GFP-LC3B punctation was quantified (E). *P < 0.01 by one-way analysis of variance (siRNA-IRE1α versus negative siRNA for A23187 and bortezomib-treated groups).
Figure 8
Figure 8
JNK but not XBP-1 contributes to proteasome inhibitor-induced autophagy. A: Wild-type and IRE1α/β-deficient MEFs were stimulated with bortezomib at the designated concentrations for 24 hours. Cells were harvested, and immunoblot assay was conducted for total JNK and phosphorylated JNK. B and C: Wild-type (a–e) and XBP-1-deficient (f–j) MEFs were treated with bortezomib (20 nmol/L, b, c, g, and h) or A23187 (2.5 μmol/L, d, e, i, and j) in the presence (c, e, h, and j) or absence (b, d, g, and i) of JNK inhibitor, SP600126 (25 μmol/L) for 16 hours. The punctation pattern of GFP-LC3B was assessed (B) and quantified (C). * and #P < 0.01 by one-way analysis of variance (SP600125 versus vehicle control for bortezomib or A23187-treated groups. *XBP-1+/+ cells; #XBP-1−/− cells). D: Bax-deficient HCT 116 cells that stably expressing GFP-LC3B were treated with vehicle control, bortezomib (20 nmol/L), or A23187 (2.5 μmol/L) with or without SP600126 (25 μmol/L) for 16 hours. The punctation pattern of GFP-LC3B was assessed and quantified. *P < 0.01 by one-way analysis of variance (SP600125 versus vehicle control for bortezomib or A23187-treated groups). E: Wild-type and XBP-1-deficient MEFs were treated with MG132 at the designated concentrations or with the ER stress inducers A23187 (A, 2.5 μmol/L), thapsigargin (TG, 0.5 μmol/L), or tunicamycin (TM, 5 μg/ml) for 24 hours. Immunoblot assay was then conducted.

Similar articles

Cited by

References

    1. Hershko A, Ciechanover A. The ubiquitin system. Annu Rev Biochem. 1998;67:425–479. - PubMed
    1. Meusser B, Hirsch C, Jarosch E, Sommer T. ERAD: the long road to destruction. Nat Cell Biol. 2005;7:766–772. - PubMed
    1. Schroder M, Kaufman RJ. The mammalian unfolded protein response. Annu Rev Biochem. 2005;74:739–789. - PubMed
    1. Harding HP, Calfon M, Urano F, Novoa I, Ron D. Transcriptional and translational control in the mammalian unfolded protein response. Annu Rev Cell Dev Biol. 2002;18:575–599. - PubMed
    1. Rao RV, Ellerby HM, Bredesen DE. Coupling endoplasmic reticulum stress to the cell death program. Cell Death Differ. 2004;11:372–380. - PubMed

Publication types

MeSH terms