A functionally specialized population of mucosal CD103+ DCs induces Foxp3+ regulatory T cells via a TGF-beta and retinoic acid-dependent mechanism
- PMID: 17620361
- PMCID: PMC2118683
- DOI: 10.1084/jem.20070590
A functionally specialized population of mucosal CD103+ DCs induces Foxp3+ regulatory T cells via a TGF-beta and retinoic acid-dependent mechanism
Abstract
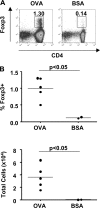
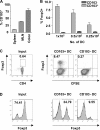
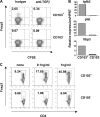
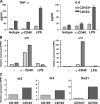
Foxp3(+) regulatory T (T reg) cells play a key role in controlling immune pathological re actions. Many develop their regulatory activity in the thymus, but there is also evidence for development of Foxp3(+) T reg cells from naive precursors in the periphery. Recent studies have shown that transforming growth factor (TGF)-beta can promote T reg cell development in culture, but little is known about the cellular and molecular mechanisms that mediate this pathway under more physiological conditions. Here, we show that after antigen activation in the intestine, naive T cells acquire expression of Foxp3. Moreover, we identify a population of CD103(+) mesenteric lymph node dendritic cells (DCs) that induce the development of Foxp3(+) T reg cells. Importantly, promotion of T reg cell responses by CD103(+) DCs is dependent on TGF-beta and the dietary metabolite, retinoic acid (RA). These results newly identify RA as a cofactor in T reg cell generation, providing a mechanism via which functionally specialized gut-associated lymphoid tissue DCs can extend the repertoire of T reg cells focused on the intestine.
Figures


Comment in
-
Oral tolerance: is it all retinoic acid?J Exp Med. 2007 Aug 6;204(8):1737-9. doi: 10.1084/jem.20071251. Epub 2007 Jul 9. J Exp Med. 2007. PMID: 17620364 Free PMC article.
Similar articles
-
Mesenteric lymph node CD11b- CD103+ PD-L1High dendritic cells highly induce regulatory T cells.Immunology. 2017 Sep;152(1):52-64. doi: 10.1111/imm.12747. Epub 2017 Jun 1. Immunology. 2017. PMID: 28423181 Free PMC article.
-
Intestinal dendritic cells specialize to activate transforming growth factor-β and induce Foxp3+ regulatory T cells via integrin αvβ8.Gastroenterology. 2011 Nov;141(5):1802-12. doi: 10.1053/j.gastro.2011.06.057. Epub 2011 Jun 30. Gastroenterology. 2011. PMID: 21723222 Free PMC article.
-
Cutting edge: inhaled antigen upregulates retinaldehyde dehydrogenase in lung CD103+ but not plasmacytoid dendritic cells to induce Foxp3 de novo in CD4+ T cells and promote airway tolerance.J Immunol. 2013 Jul 1;191(1):25-9. doi: 10.4049/jimmunol.1300193. Epub 2013 Jun 3. J Immunol. 2013. PMID: 23733880 Free PMC article.
-
Development and functional specialization of CD103+ dendritic cells.Immunol Rev. 2010 Mar;234(1):268-81. doi: 10.1111/j.0105-2896.2009.00874.x. Immunol Rev. 2010. PMID: 20193025 Review.
-
CD103+ GALT DCs promote Foxp3+ regulatory T cells.Mucosal Immunol. 2008 Nov;1 Suppl 1:S34-8. doi: 10.1038/mi.2008.43. Mucosal Immunol. 2008. PMID: 19079226 Review.
Cited by
-
Dietary medium-chain triglycerides promote oral allergic sensitization and orally induced anaphylaxis to peanut protein in mice.J Allergy Clin Immunol. 2013 Feb;131(2):442-50. doi: 10.1016/j.jaci.2012.10.011. Epub 2012 Nov 22. J Allergy Clin Immunol. 2013. PMID: 23182172 Free PMC article.
-
Characterization of regulatory dendritic cells differentiated from the bone marrow of UV-irradiated mice.Immunology. 2013 Dec;140(4):399-412. doi: 10.1111/imm.12145. Immunology. 2013. PMID: 23826713 Free PMC article.
-
Immunogenetic control of the intestinal microbiota.Immunology. 2015 Jul;145(3):313-22. doi: 10.1111/imm.12474. Epub 2015 Jun 3. Immunology. 2015. PMID: 25913295 Free PMC article. Review.
-
The Impacts of Iron Overload and Ferroptosis on Intestinal Mucosal Homeostasis and Inflammation.Int J Mol Sci. 2022 Nov 17;23(22):14195. doi: 10.3390/ijms232214195. Int J Mol Sci. 2022. PMID: 36430673 Free PMC article. Review.
-
Dendritic cell metabolism.Nat Rev Immunol. 2015 Jan;15(1):18-29. doi: 10.1038/nri3771. Nat Rev Immunol. 2015. PMID: 25534620 Free PMC article. Review.
References
-
- Coombes, J.L., N.J. Robinson, K.J. Maloy, H.H. Uhlig, and F. Powrie. 2005. Regulatory T cells and intestinal homeostasis. Immunol. Rev. 204:184–194. - PubMed
-
- Kretschmer, K., I. Apostolou, D. Hawiger, K. Khazaie, M.C. Nussenzweig, and H. von Boehmer. 2005. Inducing and expanding regulatory T cell populations by foreign antigen. Nat. Immunol. 6:1219–1227. - PubMed
-
- Sun, J.B., S. Raghavan, A. Sjoling, S. Lundin, and J. Holmgren. 2006. Oral tolerance induction with antigen conjugated to cholera toxin B subunit generates both Foxp3+CD25+ and Foxp3−CD25− CD4+ regulatory T cells. J. Immunol. 177:7634–7644. - PubMed
-
- Thorstenson, K.M., and A. Khoruts. 2001. Generation of anergic CD25+CD4+ T cells with immunoregulatory potential in vivo following induction of peripheral tolerance with intravenous or oral antigen. J. Immunol. 167:188–195. - PubMed
Publication types
MeSH terms
Substances
Grants and funding
LinkOut - more resources
Full Text Sources
Other Literature Sources
Molecular Biology Databases
Research Materials

