. 2007 Jul 2;178(1):71-84.
doi: 10.1083/jcb.200611064.

The mitochondrial E3 ubiquitin ligase MARCH5 is required for Drp1 dependent mitochondrial division

Affiliations

The mitochondrial E3 ubiquitin ligase MARCH5 is required for Drp1 dependent mitochondrial division

Mariusz Karbowski et al. J Cell Biol. .

Abstract

We identify a mitochondrial E3 ubiquitin ligase, MARCH5, as a critical regulator of mitochondrial fission. MARCH5 RING mutants and MARCH5 RNA interference induce an abnormal elongation and interconnection of mitochondria indicative of an inhibition of mitochondrial division. The aberrant mitochondrial phenotypes in MARCH5 RING mutant-expressing cells are reversed by ectopic expression of Drp1, but not another mitochondrial fission protein Fis1. Moreover, as indicated by abnormal clustering and mitochondrial accumulation of Drp1, as well as decreased cellular mobility of YFP-Drp1 in cells expressing MARCH5 RING mutants, MARCH5 activity regulates the subcellular trafficking of Drp1, likely by impacting the correct assembly at scission sites or the disassembly step of fission complexes. Loss of this activity may account for the observed mitochondrial division defects. Finally, MARCH5 RING mutants and endogenous Drp1, but not wild-type MARCH5 or Fis1, co-assemble into abnormally enlarged clusters in a Drp1 GTPase-dependent manner, suggesting molecular interactions among these proteins. Collectively, our data suggest a model in which mitochondrial division is regulated by a MARCH5 ubiquitin-dependent switch.


Figures
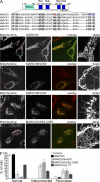
Figure 1.
Figure 1.
Mutations of the MARCH5 RING domain induce abnormal morphology of mitochondria. MARCH5 structure and the sequence homology of RINGv domains of various E3 ubiquitin ligases. The conserved histidine 43 (red) and cysteines 65 and 68 (blue) that are predicted to affect MARCH5 RING finger domain activity were mutated resulting in H43W and C65S,C68S mutants (A). Mitochondrial morphology in HeLa cells expressing wild type MARCH5-YFP, (green; B), MARCH5H43W-YFP (green; C and D), and MARCH5C65S,C68S-YFP (green; E) was analyzed by confocal microscopy. Mitochondria (red) were revealed by staining for cytochrome c. Number of cells with control-like tubular mitochondria, abnormally connected mitochondria, and with mitochondria predominantly localizing in perinuclear regions were scored (F). Data represent the average ± SD of four transfections per condition with 100 cells counted each time.
Figure 2.
Figure 2.
MARCH5 RNAi-induced abnormal mitochondrial interconnection. (A) GFP RNAi or MARCH5 RNAi cells harvested 9 d after transfection with GFP- and MARCH5-silencing vectors were analyzed for MARCH5 by Western blot. The expression levels of Mfn2, Drp1, and Fis1 proteins implicated in the regulation of mitochondrial dynamics were also tested. Anti-α-tubulin antibodies were used as a loading control. (B–D) Mitochondrial morphology, as revealed by anti-Tom20 mAbs, in GFP RNAi and MARCH5 RNAi cells was analyzed by confocal microscopy. Number of cells with control-like tubular mitochondria, abnormally connected, and fragmented mitochondria was scored in GFP RNAi and MARCH5 RNAi cells (D). Data represent the average ± SD of three transfections per condition with 150 cells counted each time.
Figure 3.
Figure 3.
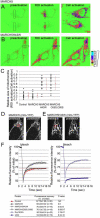
Quantification of mitochondrial volume and connectivity in cells expressing MARCH5 RING mutants. The mito-PAGFP diffusion-based assay (A–C) and FRAP (D–F) were used to investigate the relative size of mitochondrial network units in wild-type MARCH5 and MARCH5 RING mutant–expressing cells. For the mito-PAGFP based mitochondrial interconnectivity assay, cells were cotransfected with CFP-tagged WT MARCH5 (A and C), MARCH5H43W (B and C), MARCH5C65S,C68S (C) together with mito-PAGFP or transfected with mito-PAGFP alone (C). The pseudocolored images of typical cells expressing wild-type MARCH5 (A) and MARCH5H43W (B) are shown. The degree of mitochondrial interconnectivity was quantified using MetaMorph image analysis software (C). Red bars show averages ± SD of 17 measurements per experimental group, as indicated. Black diamonds represent values obtained from each single cell measurement (C). HeLa cells transiently cotransfected with CFP-tagged WT MARCH5, MARCH5H43W, MARCH5C65S,C68S-YFP together with mito-YFP or transfected with mito-YFP alone were assayed by FRAP for mitochondrial volume. The typical control, mito-YFP expressing cell (D), and cell expressing MARCH5H43W and mito-YFP (E) used in FRAP experiments are shown before and directly after photobleaching of regions of interest indicated with red rings. FRAP curves obtained after averaging of 19 single cell analysis per group, as well as the degree of FRAP in the indicated experimental groups are shown in F.
Figure 4.
Figure 4.
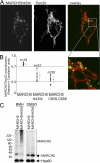
Submitochondrial coalescence of MARCH5 RING mutants. HeLa cells expressing wild-type MARCH5-YFP, MARCH5H43W-YFP, and MARCH5C65S,C68S-YFP were immunostained for Tom20, and analyzed by confocal microscopy. An example of a cell expressing MARCH5H43W-YFP (green) and immunostained for Tom20 (red) that was used for the analysis is shown in A. The colocalization degree of Tom20 with MARCH5 proteins was performed using the image analysis software Volocity (B). The values shown in B represent Pearson's Correlation units (r) that reveal the degree of association of pixels in different channels of the confocal image. (C) The oligomeric states of Myc-tagged wild-type MARCH5 and MARCH5H43W were analyzed by Western blot in cells treated with the chemical cross-linker BMH or with the solvent DMSO. Mitochondria- enriched heavy membrane fractions (HM) were subjected to SDS-PAGE and Western blot analysis. MARCH5 was detected with anti-Myc mAbs. The loading was controlled with anti Hsp60 mAbs. Asterisk represents non-specific band.
Figure 5.
Figure 5.
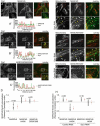
Drp1 colocalizes with mitochondrial complexes of MARCH5 RING mutants. Cells transfected with MARCH5-YFP (A; green), MARCH5H43W-YFP (B; green) and MARCH5C65S,C68S-YFP (C; green) were immunostained for Drp1 (red) and analyzed by confocal microscopy. The inserts in A–C show magnified fragments (white squares) of the respective cells. Relative fluorescence intensities of Drp1 (red lines) and MARCH5 variants (green lines) located in cell areas indicated in the respective images were measured using Zeiss LSM510 software (A′–C′). Note the high degree of the MARCH5 and Drp1 linescan overlap in MARCH5 RING mutant–expressing cells. The overall degree of Drp1 colocalization with different variants of MARCH5 was analyzed using the colocalization function of Volocity software (D). Values shown represent Pearson's Correlation units (see text). Drp1 RNAi (E, F, and H) and control RNAi (G and H) cells obtained as described previously (Lee et al., 2004), were transfected with MARCH5-YFP (E and H) and MARCH5H43W-YFP (F–H), immunostained for Tom20 to reveal the OMM (red in overlay images) and analyzed by confocal microscopy. The bottom panels in E and F show magnified fragments of cells indicated by red squares. Arrows indicate peroxisomes, arrowheads mitochondria. The association of MARCH5 and MARCH5H43W with Tom20 in control RNAi and Drp1 RNAi cells was quantified (H). The degrees of association are shown as Pearson's Correlation units (r).
Figure 6.
Figure 6.
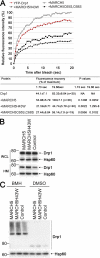
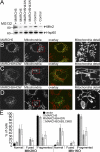
MARCH5 RING mutations decrease cellular mobility of Drp1. HeLa cells transiently transfected with YFP-Drp1 with or without cotransfection with MARCH5-CFP, MARCH5H43W-CFP, and MARCH5C65S,C68S-CFP were analyzed for cellular mobility of Drp1 with the FRAP assay (A). The averaged recovery curves and the FRAP values quantified at 1.73 s and 19.66 s after photobleach in the indicated experimental groups are shown at the bottom (A). The degree of Drp1 association with mitochondria was analyzed by Western blot (B). The whole cell lysate (WCL) and mitochondria- enriched heavy membrane (HM) fractions were obtained from HeLa cells transfected with Myc-tagged, wild-type MARCH5 and MARCH5H43W. Proteins were resolved using SDS-PAGE and then immunostained for Drp1. The loading was controlled with anti-Hsp60 antibodies. The HM fractions obtained from cells expressing Myc-tagged, wild-type MARCH5, and MARCH5H43W were also treated with a chemical cross-linker BMH, or with solvent DMSO. The samples were analyzed by Western blot for Drp1 (C).
Figure 7.
Figure 7.
Expression of MARCH5 RING mutants restores tubular mitochondria in Mfn1KO and Mfn2KO cells. (A) Expression levels of endogenous Mfn2 in wild-type MARCH5 and MARCH5H43W-expressing cells was analyzed by Western blot. The whole cell lysate (WCL) and mitochondria-enriched heavy membrane (HM) fractions were obtained from HeLa cells incubated in the presence and absence of MG132 and transfected with Myc-tagged MARCH5 and MARCH5H43W. Proteins were resolved using SDS-PAGE and then immunostained with anti-Mfn2 polyclonal antibodies. The loading was controlled by immunostaining with anti-Hsp60 antibodies. Mfn2KO cells transfected with MARCH5-YFP (B; yellow on overlay image) or MARCH5H43W-YFP (C and D; green on overlay images) were stained with anti-cytochrome c mAbs to reveal mitochondria (red on overlay images) and analyzed by confocal microscopy. In E, cells were scored for the morphology of mitochondria. Data represent averages ± SD of three transfections with 100 cells counted each time.
Figure 8.
Figure 8.
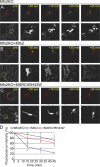
Effect of MARCH5H43W on mitochondrial fusion rates in Mfn2KO cells. Mitochondrial fusion in Mfn2KO MEFs (A and D), Mfn2KO MEFs ectopically expressing Mfn2 (B and D), or MARCH5H43W-CFP (C and D) was analyzed using mito-PAGFP dilution based assay. Details of the cell areas containing photoactivated mito-PAGFP (red squares) are shown below the respective images. The images of cells before photoactivation were obtained with the higher detector gain. The dilution rates of mito-PAGFP over the time of the experiment were quantified (D). Data was normalized, with the mito-PAGFP fluorescence at 30 s after photoactivation used as 100%. Data represent averages ± SD of 62 (Mfn2KO cells), 53 (Mfn2KO cells expressing MARCH5H43W), and 32 (Mfn2KO cells ectopically expressing Mfn2) ROI measurements (D).
Figure 9.
Figure 9.
Ectopic expression of Drp1 reverses MARCH5 mutation-induced mitochondrial morphology defects. HeLa cells were transiently transfected with MARCH5-YFP, MARCH5H43W-YFP (A; green), and MARCH5C65S,C68S-YFP (B; green) in the presence of cotransfection with Drp1 and then immunostained with anti-Tom20 polyclonal antibodies (A and B; blue) and with anti-Drp1 mAbs (A and B; red). Asterisk represents the transfected cell in the field. Cells were scored for the morphology of mitochondria. Data represent averages ± SD of four transfections with 100 cells counted each time (C).

Similar articles

Cited by

References

    1. Bartee, E., M. Mansouri, B.T. Hovey Nerenberg, K. Gouveia, and K. Fruh. 2004. Downregulation of major histocompatibility complex class I by human ubiquitin ligases related to viral immune evasion proteins. J. Virol. 78:1109–1120. - PMC - PubMed
    1. Bhar, D., M.A. Karren, M. Babst, and J.M. Shaw. 2006. Dimeric Dnm1-G385D interacts with Mdv1 on mitochondria and can be stimulated to assemble into fission complexes containing Mdv1 and Fis1. J. Biol. Chem. 281:17312–17320. - PubMed
    1. Bleazard, W., J.M. McCaffery, E.J. King, S. Bale, A. Mozdy, Q. Tieu, J. Nunnari, and J.M. Shaw. 1999. The dynamin-related GTPase Dnm1 regulates mitochondrial fission in yeast. Nat. Cell Biol. 1:298–304. - PMC - PubMed
    1. Bottomley, M.J., G. Stier, D. Pennacchini, G. Legube, B. Simon, A. Akhtar, M. Sattler, and G. Musco. 2005. NMR structure of the first PHD finger of autoimmune regulator protein (AIRE1). Insights into autoimmune polyendocrinopathy-candidiasis-ectodermal dystrophy (APECED) disease. J. Biol. Chem. 280:11505–11512. - PubMed
    1. Chan, D.C. 2006. Mitochondria: dynamic organelles in disease, aging, and development. Cell. 125:1241–1252. - PubMed

Publication types

MeSH terms