. 2007 Sep;81(17):9299-306.
doi: 10.1128/JVI.00537-07. Epub 2007 Jun 20.

Epstein-Barr virus latent membrane protein 2A mediates transformation through constitutive activation of the Ras/PI3-K/Akt Pathway

Affiliations

Epstein-Barr virus latent membrane protein 2A mediates transformation through constitutive activation of the Ras/PI3-K/Akt Pathway

Makoto Fukuda et al. J Virol. 2007 Sep.

Abstract

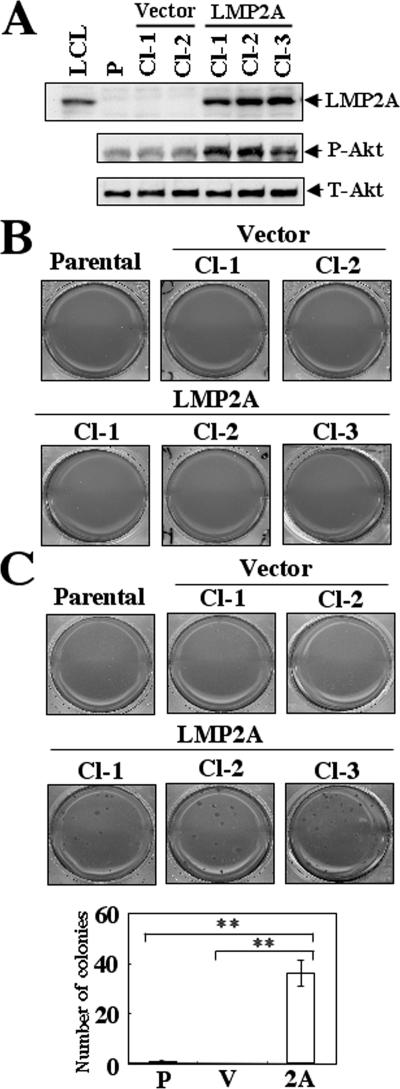
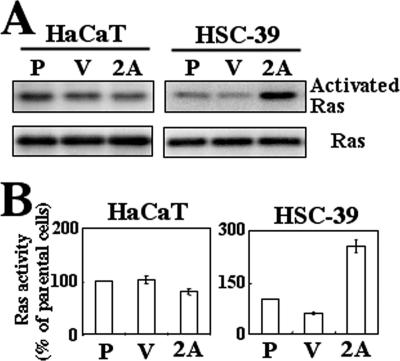
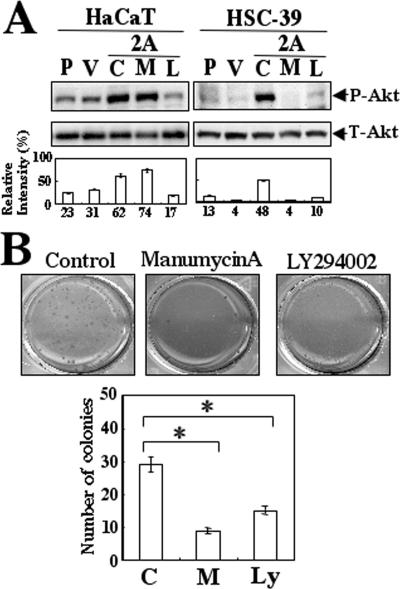
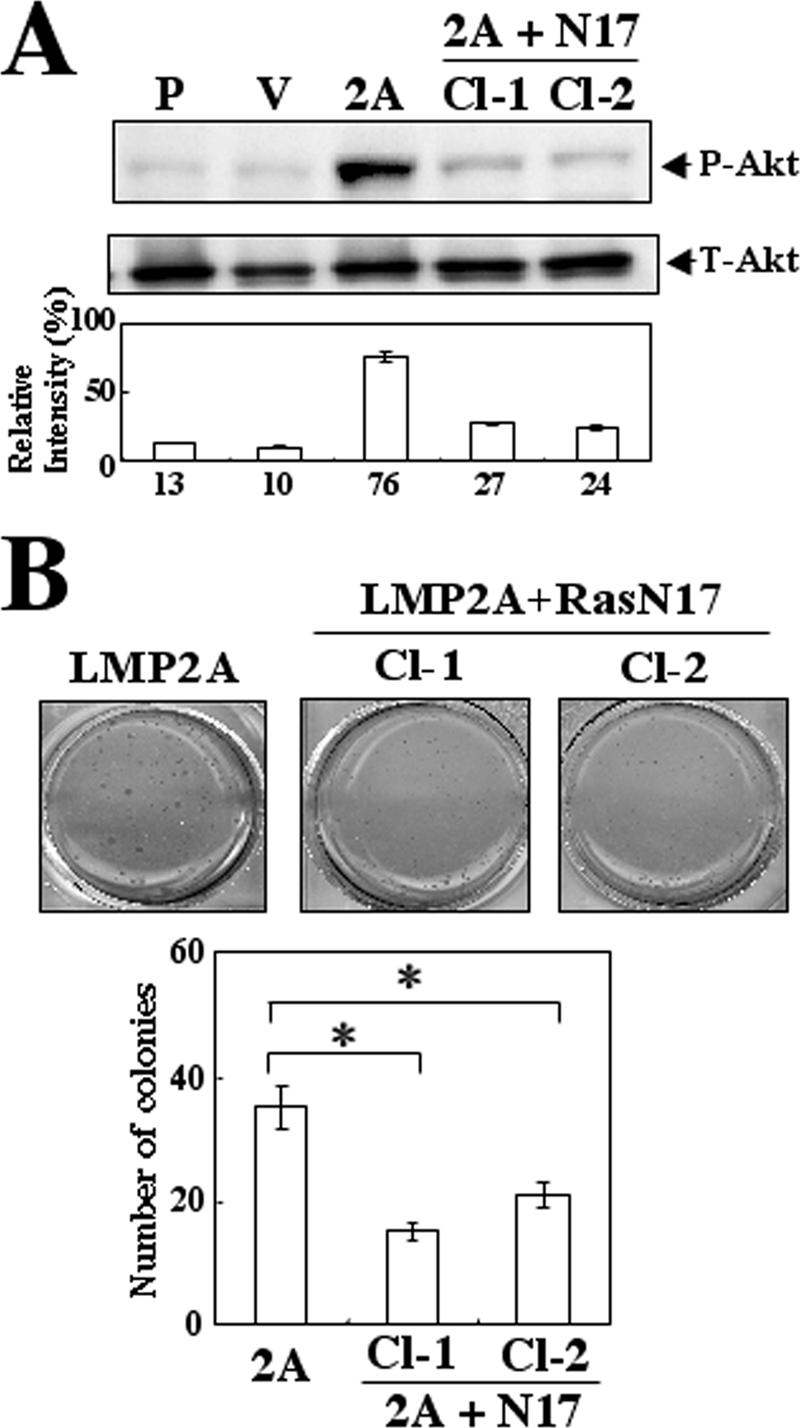
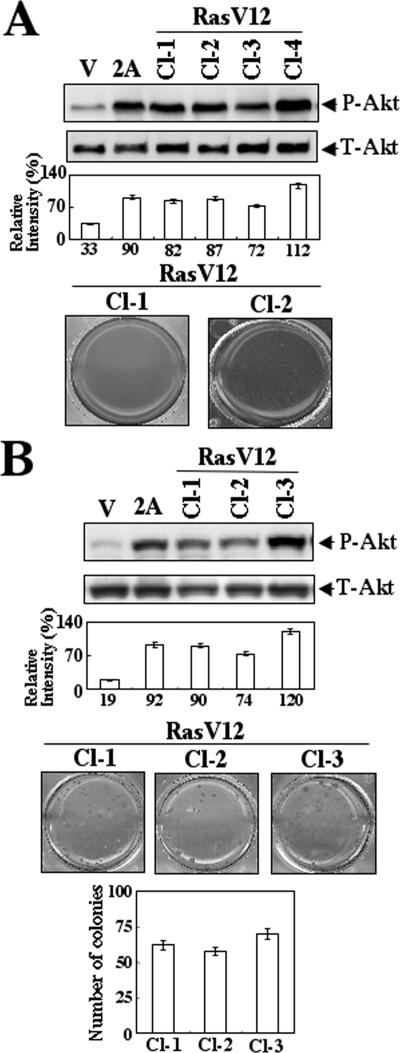
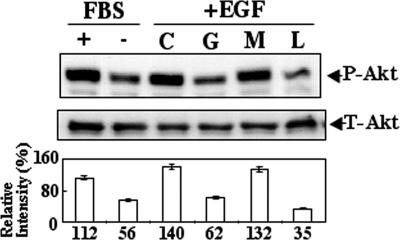
Epstein-Barr virus (EBV) latent membrane protein 2A (LMP2A) is widely expressed in EBV-infected cells within the infected human host and EBV-associated malignancies, suggesting that LMP2A is important for EBV latency, persistence, and EBV-associated tumorigenesis. Previously, we demonstrated that LMP2A provides an antiapoptotic signal through the activation of phosphatidylinositol 3-kinase (PI3-K)/Akt pathway in vitro. However, the exact function of LMP2A in tumor progression is not well understood. In this study, we found that LMP2A did not induce anchorage-independent cell growth in a human keratinocyte cell line, HaCaT, but did in a human gastric carcinoma cell line, HSC-39. In addition, LMP2A activated the PI3-K/Akt pathway in both HaCaT and HSC-39 cells; however, LMP2A did not activate Ras in HaCaT cells but did in HSC-39 cells. Furthermore, the Ras inhibitors manumycin A and a dominant-negative form of Ras (RasN17) and the PI3-K inhibitor LY294002 blocked LMP2A-mediated Akt phosphorylation and anchorage-independent cell growth in HSC-39 cells. These results suggest that constitutive activation of the Ras/PI3-K/Akt pathway by LMP2A is a key factor for LMP2A-mediated transformation.


Figures

FIG. 1.
FIG. 1.
Effect of LMP2A expression on anchorage-independent cell growth in HaCaT and HSC-39 cells. (A) HaCaT cells were stably retrovirally transduced with LMP2A or vector control expression constructs. After 2 h of serum starvation, whole-cell extracts were separated by SDS-PAGE, and the expression levels of LMP2A (54 kDa), phospho-specific Akt (P-Akt) (on serine 473) (60 kDa) were determined by immunoblotting in parental (P), vector control (Vector), and LMP2A-expressing HaCaT cells. The lower panel shows equal loading of total Akt (T-Akt). (B) The ability of LMP2A to induce anchorage-independent cell growth in HaCaT cells. Parental, vector control (Vector), or LMP2A-expressing HaCaT cells (1 × 10⁴ cells) were cultured in soft agar for 3 weeks. Colonies were defined as cell clusters greater than 200 μm in size and scored. Representative images from one of three independent experiments. (C) The ability of LMP2A to induce anchorage-independent cell growth in HSC-39 cells. Parental, vector control (Vector), or LMP2A-expressing HSC-39 cells (1 × 10⁴ cells) were cultured in soft agar for 3 weeks. Colonies were defined as cell clusters greater than 200 μm in size and scored. Representative images from one of three independent experiments are shown. The average numbers of foci of parental (P), vector control (V), or LMP2A-expressing (2A) HSC-39 cells formed in a well from three independent experiments are shown in the graph; error bars indicate standard deviations. Data were analyzed by Student's t test. Values that were statistically significantly different from each other (P < 0.001) are indicated (**).
FIG. 2.
FIG. 2.
Expression of activated Ras in LMP2A-expressing HaCaT and HSC-39 cells. (A) Parental (P), vector control (V), and LMP2A-expressing (2A) HaCaT and HSC-39 cells were cultured for 2 h without serum. Ras activation was evaluated by pulling down active GTP-loaded Ras with a GST fusion protein containing the RBD of Raf-1 (GST-Raf1-RBD) and blotting with anti-Ras antibody. Equal quantities of Ras in the extracts were confirmed by immunoblotting a fraction of the total cell lysates taken before pulling down GST-Raf1-RBD. (B) The extent of expression of activated Ras and total Ras protein from panel A was quantified using ImageJ software. The relative level was calculated as the ratio of activated Ras to total Ras protein levels. The ratios are normalized to the level of Ras activity of the parental cells, which was set at 1. Results are expressed as the means ± standard deviations (error bars) for three experiments.
FIG. 3.
FIG. 3.
Effect of manumycin A or LY294002 on Akt phosphorylation and anchorage-independent cell growth in LMP2A-expressing cells. (A) Parental (P), vector control (V), and LMP2A-expressing (2A) HaCaT and HSC-39 cells were cultured for 1 h without serum, and then the cells were incubated for 1 h without manumycin A (control [C]) or with manumycin A (M) (10 μM) or LY294002 (L) (25 μM). Equal amounts of protein from the respective cells were separated by SDS-PAGE. The levels of phospho-specific Akt (P-Akt) (on serine 473) (60 kDa) were determined by immunoblotting. The bottom blots show equal loading of protein and expression of Akt (T-Akt) (60 kDa). The extent of expression of P-Akt and T-Akt proteins was quantified using ImageJ software. The relative level was calculated as the ratio of P-Akt to T-Akt protein levels. Results are expressed as the mean ± standard deviations (error bars) for three experiments. (B) LMP2A-expressing HSC-39 cells (1 × 10⁴ cells) were cultured in soft agar without manumycin A (Control) or with manumycin A (10 μM) or LY294002 (25 μM) for 3 weeks. Colonies were defined as cell clusters greater than 400 μm in size and scored. Representative images from one of three independent experiments are shown. The average number of foci formed from LMP2A-expressing HSC-39 cells cultured without manumycin A (control [C]) or with manumycin A (M) or LY294002 (Ly) in a well from three independent experiments is shown; error bars indicate standard deviations. Data were analyzed by Student's t test. Values that were statistically significantly different (P < 0.05) from each other are indicated (*).
FIG. 4.
FIG. 4.
Dominant-negative Ras mutant (RasN17) inhibits Akt phosphorylation and anchorage-independent cell growth in LMP2A-expressing HSC-39 cells. (A) LMP2A-induced Akt phosphorylation was inhibited in HSC-39 cells expressing both LMP2A and RasN17. Parental (P), vector control (V), LMP2A-expressing (2A), and LMP2A-RasN17-coexpressing (2A + N17) HSC-39 cells were cultured for 1 h without serum. Equal amounts of protein from the respective cells was separated by SDS-PAGE. The levels of phospho-Akt (P-Akt) (serine 473) (60 kDa) were determined by immunoblotting. The bottom blots show equal loading of protein and expression of Akt (T-Akt) (60 kDa). The extent of expression of P-Akt and T-Akt proteins was quantified using a densitometer with ImageJ software. The relative level was calculated as the ratio of P-Akt to T-Akt protein levels. Results are expressed as the means ± standard deviations (error bars) for three experiments. (B) Soft agar colony formation of LMP2A-RasN17-coexpressing HSC-39 cells. LMP2A-expressing and LMP2A-RasN17-coexpressing (LMP2A+N17) HSC-39 cells (1 × 10⁴ cells) were cultured in soft agar for 3 weeks. Colonies were defined as cell clusters greater than 400 μm in size and scored. Representative images from one of three independent experiments are shown. The average number of foci formed in a well from three independent experiments are shown; error bars indicate standard deviations. Data were analyzed by Student's t test. Values that were statistically significantly different (P < 0.05) from each other are indicated (*).
FIG. 5.
FIG. 5.
Effect of active Ras mutant (RasV12) on the induction of Akt phosphorylation and anchorage-independent cell growth in HaCaT and HSC-39 cells. (A and B) Vector (V), LMP2A-expressing (2A), and RasV12-expressing HaCaT cells (A) and HSC-39 cells (B) were cultured for 1 h without serum. Equal amounts of protein from the respective cells were separated by SDS-PAGE. The levels of phospho-Akt (P-Akt) (serine 473) (60 kDa) were determined by immunoblotting. The bottom blots show equal loading of protein and expression of Akt (T-Akt) (60 kDa). The extent of expression of P-Akt and T-Akt proteins was quantified using ImageJ software. (Bottom left) The relative level was calculated as the ratio of P-Akt to T-Akt protein levels. Results are expressed as the means ± standard deviations (error bars) for three experiments. (Right) Soft agar colony formation of RasV12-expressing HaCaT (Cl-1 and Cl-2) (A) and HSC-39 (Cl-1, Cl-2, and Cl-3) cells (B). Cells (1 × 10⁴ cells) were cultured in soft agar for 3 weeks. Colonies were defined as cell clusters greater than 200 μm in size and scored. Representative images from one of three independent experiments are shown. (Bottom right) The average number of foci formed in a well from three independent experiments is shown; error bars indicate standard deviations.
FIG. 6.
FIG. 6.
Effect of manumycin A or LY294002 on EGF-induced Akt phosphorylation in HaCaT cells. Cells were cultured for 1 h with (+) or without (−) serum (FBS) and then preincubated for 10 min with genistein (G) (30 μg/ml) or for 30 min with manumycin A (M) (10 μM) or LY294002 (L) (25 μM), and then cells were treated with EGF (10 ng/ml) for 10 min. Control cells (C) were not treated. Equal amounts of protein from the respective cells were separated by SDS-PAGE. The levels of phospho-Akt (P-Akt) (serine 473) (60 kDa) were determined by immunoblotting. The bottom blot shows equal loading of protein and expression of Akt (T-Akt) (60 kDa). The extent of expression of P-Akt and T-Akt proteins was quantified by using ImageJ software. The relative level was calculated as the ratio of P-Akt to T-Akt protein levels. Results are expressed as the means ± standard deviations (error bars) for three experiments.

Similar articles

Cited by

References

    1. Barbacid, M. 1987. ras genes. Annu. Rev. Biochem. 56:779-827. - PubMed
    1. Bell, A. I., K. Groves, G. L. Kelly, D. Croom-Carter, E. Hui, A. T. Chan, and A. B. Rickinson. 2006. Analysis of Epstein-Barr virus latent gene expression in endemic Burkitt's lymphoma and nasopharyngeal carcinoma tumour cells by using quantitative real-time PCR assays. J. Gen. Virol. 87:2885-2890. - PubMed
    1. Boukamp, P., R. T. Petrussevska, D. Breitkreutz, J. Hornung, A. Markham, and N. E. Fusenig. 1988. Normal keratinization in a spontaneously immortalized aneuploid human keratinocyte cell line. J. Cell Biol. 106:761-771. - PMC - PubMed
    1. Boukamp, P., E. J. Stanbridge, D. Y. Foo, P. A. Cerutti, and N. E. Fusenig. 1990. c-Ha-ras oncogene expression in immortalized human keratinocytes (HaCaT) alters growth potential in vivo but lacks correlation with malignancy. Cancer Res. 50:2840-2847. - PubMed
    1. Breitkreutz, D., P. Boukamp, C. M. Ryle, H. J. Stark, D. R. Roop, and N. E. Fusenig. 1991. Epidermal morphogenesis and keratin expression in c-Ha-ras-transfected tumorigenic clones of the human HaCaT cell line. Cancer Res. 51:4402-4409. - PubMed

Publication types

MeSH terms

LinkOut - more resources