. 2007 Jul;5(7):e172.
doi: 10.1371/journal.pbio.0050172. Epub 2007 Jun 19.

PINK1 protects against oxidative stress by phosphorylating mitochondrial chaperone TRAP1

Affiliations

PINK1 protects against oxidative stress by phosphorylating mitochondrial chaperone TRAP1

Julia W Pridgeon et al. PLoS Biol. 2007 Jul.

Abstract

Mutations in the PTEN induced putative kinase 1 (PINK1) gene cause an autosomal recessive form of Parkinson disease (PD). So far, no substrates of PINK1 have been reported, and the mechanism by which PINK1 mutations lead to neurodegeneration is unknown. Here we report the identification of TNF receptor-associated protein 1 (TRAP1), a mitochondrial molecular chaperone also known as heat shock protein 75 (Hsp75), as a cellular substrate for PINK1 kinase. PINK1 binds and colocalizes with TRAP1 in the mitochondria and phosphorylates TRAP1 both in vitro and in vivo. We show that PINK1 protects against oxidative-stress-induced cell death by suppressing cytochrome c release from mitochondria, and this protective action of PINK1 depends on its kinase activity to phosphorylate TRAP1. Moreover, we find that the ability of PINK1 to promote TRAP1 phosphorylation and cell survival is impaired by PD-linked PINK1 G309D, L347P, and W437X mutations. Our findings suggest a novel pathway by which PINK1 phosphorylates downstream effector TRAP1 to prevent oxidative-stress-induced apoptosis and implicate the dysregulation of this mitochondrial pathway in PD pathogenesis.


Conflict of interest statement

Competing interests. The authors have declared that no competing interests exist.

Figures

Figure 1
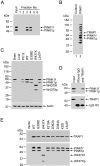
Figure 1. Interaction of TRAP1 with Wild-Type and Mutant PINK1
(A) Lysates of HeLa cells expressing C-terminally FLAG-tagged wild-type PINK1 (Input) were affinity purified with anti-FLAG M2 affinity gel, and the eluate fractions were analyzed by immunoblotting with anti-FLAG antibody. (B) Affinity-purified proteins from PINK1-transfected cells and vector control were resolved on SDS-PAGE and detected by Ponceau S staining. Arrows indicate three bands identified by mass spectrometry as TRAP1, PINK1f, and PINK1p. (C) Specificity of the polyclonal anti-PINK1 antibody. Homogenates (50 μg of protein per lane) from rat brain, liver, untransfected PC12 cells, and transfected PC12 cells expressing wild-type (WT) or mutant PINK1 were analyzed by immunoblotting with anti-PINK1 and anti-actin antibodies. (D) Endogenous PINK1 interacts with TRAP1. PC12 cell lysates (Input) were immunoprecipitated with anti-TRAP1 antibody, followed by immunoblotting with anti-PINK1 and anti-TRAP1 antibodies. IgG HC, IgG heavy chain. (E) Lysates from PC12 cells transfected with FLAG-tagged wild-type or mutant PINK1 were immunoprecipitated with anti-FLAG antibody, followed by immunoblotting using anti-TRAP1 and anti-FLAG antibodies.
Figure 2
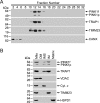
Figure 2. PINK1 and TRAP1 Colocalize in the Mitochondrial Inner Membrane and the Intermembrane Space
(A) Post-nuclear supernatants of PC12 cells were fractionated on a 5%–15% linear Optiprep gradient, and the fractions were analyzed by immunoblotting for PINK1, TRAP1, TIMM23, and CANX. (B) Mitochondria (Mito) isolated from PC12 cells were fractionated into matrix, inner mitochondrial membrane (IM), intermembrane space (IMS), and outer mitochondrial membrane (OM) fractions, and analyzed by immunoblotting for PINK1, TRAP1, and markers of mitochondrial subcompartments: HSPD1 (matrix), TIMM23 (IM), cytochrome c (IMS), and VDAC (OM).
Figure 3
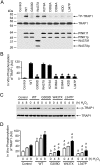
Figure 3. Phosphorylation of TRAP1 by Wild-Type and Mutant PINK1
(A) In vitro kinase assays were performed by incubation of purified TRAP1 with [γ32-P] ATP in the absence (control) or presence of FLAG-tagged wild-type (WT) or mutant PINK1 proteins as indicated. Phosphorylated TRAP1 was visualized by autoradiography (top panel). PINK1 and TRAP1 proteins used in the kinase assays were shown by immunoblotting with anti-TRAP1 (middle panel) and anti-FLAG antibodies (bottom panel). (B) Normalized levels of in vitro TRAP1 phosphorylation by wild-type or mutant PINK1. Data represent mean ± standard error of the mean (SEM) from three independent experiments. *Significantly different from the wild-type PINK1 (p < 0.01). (C) PC12 cells expressing wild-type or mutant PINK1 or vector-transfected controls were treated with 400 μM H2O2 as indicated. In vivo phosphorylation of endogenous TRAP1 was determined by immunoprecipitation with anti-TRAP1 antibody followed by immunoblotting using anti-phosphoserine (upper panel) and anti-TRAP1 (lower panel) antibodies. (D) Normalized levels of in vivo TRAP1 phosphorylation by wild-type or mutant PINK1. Data represent mean ± SEM from three independent experiments. aSignificantly different from the corresponding H2O2-treated vector-transfected controls (p < 0.01). bSignificantly different from the wild-type PINK1-transfected cells (p < 0.01). AU, arbitrary units.
Figure 4
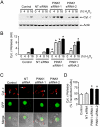
Figure 4. Wild-Type PINK1, but Not Kinase-Dead or PD-Linked Mutant PINK1, Protects against Oxidative-Stress-Induced Apoptosis
(A) PC12 cells expressing wild-type (WT) or mutant PINK1 or vector-transfected controls were treated with 400 μM H2O2 for 16 h. The extent of cell survival was assessed by using the MTT assay. Data represent mean ± SEM from three independent experiments. aSignificantly different from the vector-transfected controls (p < 0.01). bSignificantly different from the wild-type PINK1-transfected cells (p < 0.01). (B) Immunoblot analysis of cytochrome c (Cyt. c) in the cytosol and mitochondria fractions isolated from PC12 cells expressing wild-type or mutant PINK1 after treatment with 400 μM H2O2 for the indicated times. (C) The level of cytochrome c released to the cytosol is normalized to the total level of cytochrome c in each cell sample. Data represent mean ± SEM from three independent experiments. aSignificantly different from the corresponding H2O2-treated vector-transfected controls (p < 0.01). bSignificantly different from the wild-type PINK1-transfected cells (p < 0.01).
Figure 5
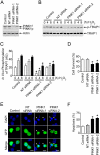
Figure 5. PINK1 Knockdown Reduces TRAP1 Phosphorylation and Protection against Oxidative Stress
(A) PC12 cells were transfected with vehicle (control), NT siRNA, or PINK1-specific siRNAs (PINK1 siRNA-1 and PINK1 siRNA-2). The levels of PINK1 and actin in the cell lysates were analyzed by immunoblotting with anti-PINK1 and anti-actin antibodies. (B) PC12 cells transfected with the indicated siRNA or vehicle (control) were treated with 400 μM H2O2 for the indicated times. In vivo phosphorylation of endogenous TRAP1 was determined by immunoprecipitation with anti-TRAP1 antibody followed by immunoblotting using anti-phosphoserine and anti-TRAP1 antibodies. (C) Normalized levels of in vivo TRAP1 phosphorylation in the control and siRNA-transfected cells. Data represent mean ± SEM from three independent experiments. *Significantly different from the corresponding H2O2-treated control cells (p < 0.01). AU, arbitrary units. (D) PC12 cells transfected with vehicle (control) or the indicated siRNAs were treated with 400 μM H2O2 for 16 h. Cell viability was assessed by using the MTT assay. Data represent mean ± SEM from three independent experiments. *Significantly different from the H2O2-treated control cells (p < 0.01). (E) PC12 cells co-transfected with an expression vector encoding enhanced green fluorescent protein (pEGFP) and vehicle (control) or indicated siRNAs were treated with 400 μM H2O2 for 16 h. Transfected cells were shown by the green fluorescence emitted by green fluorescent protein (GFP), and nuclear morphology was visualized by DAPI staining (blue). Arrowheads indicate transfected cells with apoptotic nuclei. Scale bar, 10 μm. (F) Apoptosis is expressed as the percentage of transfected cells with apoptotic nuclear morphology. Data represent mean ± SEM from three independent experiments. *Significantly different from the H2O2-treated control cells (p < 0.01).
Figure 6
Figure 6. PINK1 Depletion Increases Cytochrome c Release from Mitochondria
(A) PC12 cells transfected with the indicated siRNA or vehicle (control) were treated with 400 μM H2O2 for the indicated times. The levels of cytochrome c (Cyt. c) and actin in the cytosol were determined by immunoblotting with anti-cytochrome c and anti-actin antibodies. (B) The level of cytochrome c released to the cytosol is normalized to the level of actin in each cell sample. Data represent mean ± SEM from three independent experiments. *Significantly different from the corresponding H2O2-treated control cells (p < 0.01). AU, arbitrary units. (C) PC12 cells co-transfected with pEGFP and vehicle (control) or indicated siRNAs were treated with 400 μM H2O2 for 16 h. Cell morphology was imaged by using phase-contrast microscopy (grey), transfected cells were visualized by the green fluorescence emitted by green fluorescent protein (GFP), and the cellular distribution of cytochrome c was detected by immunostaining with anti-cytochrome c antibody (red). Transfected cells with mitochondrial cytochrome c staining are indicated by arrows, and those with diffuse, cytosolic cytochrome c staining are indicated by arrowheads. Scale bar, 10 μm. (D) Quantification of the percentage of transfected cells showing cytochrome c release. Data represent mean ± SEM from three independent experiments. *Significantly different from the H2O2-treated control cells (p < 0.05).
Figure 7
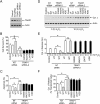
Figure 7. TRAP1 Depletion Abolishes the Effects of Wild-Type and Mutant PINK1 on Cell Vulnerability to Oxidative Stress
(A) PC12 cells were transfected with vehicle (control), NT siRNA, or TRAP1-specific siRNAs (TRAP1 siRNA-1 and TRAP1 siRNA-2). The levels of TRAP1 and actin in the cell lysates were analyzed by immunoblotting with anti-TRAP1 and anti-actin antibodies. (B) PC12 cells treated with TRAP1 siRNA-2 or NT siRNA were either untransfected (UT) or transfected with wild-type (WT) or mutant PINK1 as indicated. Vehicle-treated, non-transfected PC12 cells were used as the control. Cells were exposed to 400 μM H2O2 for 16 h, and the extent of cell survival was assessed by using the MTT assay. Data represent mean ± SEM from three independent experiments. *, p < 0.05; ns, not significant. (C) PC12 cells co-transfected with pEGFP and vehicle (control) or indicated siRNAs and PINK1 plasmids were treated with 400 μM H2O2 for 16 h, and the extent of apoptosis was determined by morphological analysis of DAPI-stained nuclei. The percentage of transfected cells with apoptotic nuclear morphology was quantified. Data represent mean ± SEM from three independent experiments. *, p < 0.05; ns, not significant. (D) The levels of cytochrome c (Cyt. c) and actin in the cytosol fractions from cells described in (B) were determined by immunoblotting with anti-cytochrome c and anti-actin antibodies. (E) The level of cytochrome c released to the cytosol is normalized to the level of actin in each cell sample. Data represent mean ± SEM from three independent experiments. *, p < 0.01; ns, not significant. AU, arbitrary units. (F) PC12 cells co-transfected with pEGFP and vehicle (control) or indicated siRNAs and PINK1 plasmids were treated with 400 μM H2O2 for 16 h, and the cellular distribution of cytochrome c was detected by immunostaining with anti-cytochrome c antibody. The percentage of transfected cells showing cytochrome c release was quantified. Data represent mean ± SEM from three independent experiments. *, p < 0.05; ns, not significant.

Comment in

Similar articles

Cited by

References

    1. Lang AE, Lozano AM. Parkinson's disease. First of two parts. N Engl J Med. 1998;339:1044–1053. - PubMed
    1. Farrer MJ. Genetics of Parkinson disease: Paradigm shifts and future prospects. Nat Rev Genet. 2006;7:306–318. - PubMed
    1. Schapira AH, Cooper JM, Dexter D, Jenner P, Clark JB, et al. Mitochondrial complex I deficiency in Parkinson's disease. Lancet. 1989;1:1269. - PubMed
    1. Betarbet R, Sherer TB, Greenamyre JT. Animal models of Parkinson's disease. Bioessays. 2002;24:308–318. - PubMed
    1. Valente EM, Abou-Sleiman PM, Caputo V, Muqit MM, Harvey K, et al. Hereditary early-onset Parkinson's disease caused by mutations in PINK1. Science. 2004;304:1158–1160. - PubMed

Publication types

MeSH terms