. 2007 Jul;9(7):755-64.
doi: 10.1038/ncb1602. Epub 2007 Jun 18.

BACE1 regulates voltage-gated sodium channels and neuronal activity

Affiliations

BACE1 regulates voltage-gated sodium channels and neuronal activity

Doo Yeon Kim et al. Nat Cell Biol. 2007 Jul.

Abstract

BACE1 activity is significantly increased in the brains of Alzheimer's disease patients, potentially contributing to neurodegeneration. The voltage-gated sodium channel (Na(v)1) beta2-subunit (beta2), a type I membrane protein that covalently binds to Na(v)1 alpha-subunits, is a substrate for BACE1 and gamma-secretase. Here, we find that BACE1-gamma-secretase cleavages release the intracellular domain of beta2, which increases mRNA and protein levels of the pore-forming Na(v)1.1 alpha-subunit in neuroblastoma cells. Similarly, endogenous beta2 processing and Na(v)1.1 protein levels are elevated in brains of BACE1-transgenic mice and Alzheimer's disease patients with high BACE1 levels. However, Na(v)1.1 is retained inside the cells and cell surface expression of the Na(v)1 alpha-subunits and sodium current densities are markedly reduced in both neuroblastoma cells and adult hippocampal neurons from BACE1-transgenic mice. BACE1, by cleaving beta2, thus regulates Na(v)1 alpha-subunit levels and controls cell-surface sodium current densities. BACE1 inhibitors may normalize membrane excitability in Alzheimer's disease patients with elevated BACE1 activity.


Figures

Figure 1
Figure 1
BACE1-mediated cleavage of β2 generates β2-CTFβ and β2-ICD. Full-length β2 (β2 FL), β2-CTFs, and β2-ICD were detected by C-terminal V5 epitope staining. (a) 16% Tricine and 12% NuPage (MOPS running buffer) gel systems resolve β2-CTFs into two separate bands in CHO cells stably transfected with β2. (b) Western blot analysis of β2 processing in CHO cells with or without overexpressing BACE1. Elevated BACE1 results in increased β2-CTFβ generation, further potentiated by the γ-secretase inhibitor DAPT. Similar changes occur in APP β-CTF, but not in the levels of the control transferrin receptor. The shorter β2-CTFα is hard to detect due to the strong increase in β2-CTFβ levels. (c) Constitutive β2-ICD generation in B104 cells stably expressing BACE1, in addition to β2. (d) Cell-free generation of β2-CTFβ in membranes isolated from CHO cells expressing BACE1 and β2, blocked by the BACE inhibitor GL189 or pH 7.0. (e) Side-by-side comparison of BACE1- and α-secretase-mediated β2-CTF generation with the indicated treatments and BACE1 transfection in CHO cells expressing β2. (f) Schematic representation of APP-like processing of β2. Approximate positions of α-, β-, and γ-secretase-like cleavages in APP and β2, and terminology of respective C-terminal cleavage products are shown.
Figure 2
Figure 2
BACE1 regulates Nav1.1 levels. (a) Representative western-blot analysis of β2-subunit and Nav1.1 α-subunit in B104 cells stably expressing β2 alone or together with BACE1. BACE1 overexpression elevates the levels of both β2-CTFs and Nav1.1. (b) Histograms showing the relative amounts of β2-CTF and Nav1.1 mRNA in stable B104 cell clones expressing β2 alone or together with BACE1. Nav1.1 mRNA levels were normalized to GAPDH levels. Relative changes in Nav1.1 mRNA were calculated by setting mRNA levels in B104 parental cells to 1. Similarly, β2-CTF levels in a B104 cell expressing only β2 was set to 1 to calculate the relative changes in β2-CTF (n = 3 for RT-PCR analysis). (c) Histogram showing relative mRNA levels of Nav1.1 and Nav1.3 in B104 cells stably expressing β2 treated with increasing concentrations of the BACE inhibitor dr9 (one way ANOVA followed by a post hoc Tukey’s test; the double asterisk indicates P <0.01; n = 3 for each condition) (d) Western blot analysis of Nav1.1 levels in B104 cells stably expressing β2 treated with increasing concentrations of dr9. (e) Endogenous β2-CTF levels in rat primary cortical neurons (DIV7). Full-length β2 and β2-CTFs were detected by both GW83 and GW93 antibodies, generated against the C-terminus of β2. The proteosomal inhibitor clasto-lactacystein β-lactone (lactacystein) was used for easy detection of endogenous β2-CTFs. The γ-secretase inhibitor DAPT elevated endogenous β2-CTF levels, whereas cotreatment with two different BACE inhibitors (dr9 and BACE inhibitor IV) specifically reduced β2-CTF and APP C99 levels. The asterisk indicates a nonspecific band. (f) Nav1.1 mRNA levels also decrease when rat primary neuronal cultures are treated with dr9 (one way ANOVA followed by a post hoc Tukey’s test, the asterisk indicates P <0.05 compared to DMSO treated cells; n = 3 for each condition). The error bars in all panels represent s.e.m.
Figure 3
Figure 3
DAPT treatment decreases Nav1.1 protein and mRNA levels. (a) Western blot analysis of β2 and Nav1.1 α-subunit in B104 cells stably expressing β2, treated with increasing concentrations of DAPT for 48 h. (b) Histograms showing relative mRNA levels of Nav1.1 and Nav1.3 in B104 cells stably expressing β2 and treated with 500 nM DAPT or DMSO control for 48 h. (Student’s t-test, the asterisk indicates P <0.05; n = 3 for each condition; DMSO treated samples were regarded as 1 for comparison). The error bars represent s.e.m.
Figure 4
Figure 4
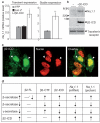
Overexpression of recombinant β2-ICD increases Nav1.1 α-subunit levels. (a) Both transient and stable expression of recombinant β2-ICD elevates Nav1.1 mRNA levels in SH-SY5Y cells. Two constructs designed to express YFP or LacZ were used as negative controls for transient expression experiments. For statistical analysis, one way ANOVA followed by a post hoc Tukey’s test was used for transient expression experiment and a Student’s t-test was used for stable expression. The single asterisk indicates P <0.05 and the double asterisk indicates P <0.01 (n = 3 for each condition). The error bars represent s.e.m. (b) Western-blot analysis of Nav1.1 levels in parental SH-SY5Y cells and the same cells stably expressing β2-ICD. (c) Confocal images of stably overexpressed β2-ICDs. β2-ICD localizes to the nuclei of SH-SY5Y cells, stained with propidium iodide in mixed cultures of SH-SY5Y cells stably expressing various levels of β2-ICD immunostained with anti-V5 antibody. (d) Summary of the results shown in Figs 2, 3 and 4. Nav1.1 levels correlate with changes in β2-ICD, not β2-CTF or full-length β2.
Figure 5
Figure 5
Endogenous β2-CTF and Nav1.1 levels increase in BACE1-transgenic mouse brains. (a) Western-blot analysis of full-length β2, β2-CTFs and Nav1.1 α-subunit in brains from two control mice (WT) and BACE1-transgenic mice (BACE1 Tg, 10 or 20-fold expression of BACE1 compared to wild-type). GW93 antibody was used to detect full-length β2 and an anti-β2 antibody was used to detect β2-CTF in mouse brains. (b) Relative Nav1.1 mRNA levels were quantified by real-time RT-PCR analysis. BACE1-Tg mice, which overexpress 10- or 20-fold BACE1, showed increased Nav1.1 mRNA levels compared to control mice of the same genetic background. The error bars of these samples represent the s.e.m. and are derived from one triplicate RT-PCR analysis. (c) Quantitative analysis of Nav1.1 protein levels in three control brains and four brains from heterozygote BACE1-transgenic mice (BACE1tg/-) expressing approximately tenfold BACE1 compared to control brains (Student’s t-test, the asterisk indicates P <0.05; n = 3 for each genotype). The error bars represent s.e.m. (d) Quantitative analysis of Nav1.1 mRNA levels in control and BACE1-transgenic brains expressing approximately tenfold BACE1 (BACE1tg/-) and 20-fold BACE1 (BACE1tg/tg). A Student’s t-test was used for statistical analysis. The asterisk indicates P <0.05 (n = 4 for BACE1tg/- and n = 3 for control mice). The error bars represent s.e.m. The sample marked # is derived from triplicate RT-PCR analysis.
Figure 6
Figure 6
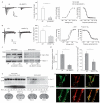
BACE1 overexpression reduces sodium-current density and surface levels of Nav1 α-subunits in B104 neuroblastoma cells and hippocampal neurons. (a) Representative Na+ current measurements from B104 cells stably expressing β2, or β2 + BACE1 (left). Peak sodium current was measured at 0 mV and normalized to cell capacitance to get current densities (middle). Current density levels decreased in cells overexpressing BACE1 (Student’s t-test, triple asterisk indicates P <0.0001; β2, n = 13; β2 + BACE1, n = 17). Mean conductance-voltage relationships and steady-state inactivation of sodium currents in B104 cells stably expressing β2 or β2 + BACE1 together are shown on the right. Data from individual experiments were fit with a Boltzmann relationship. (b) Representative sodium0current measurements from hippocampal neurons acutely-dissociated from BACE1-transgenic (BACE1 Tg) and wild-type control mice (left). Na+ current density levels decreased in hippocampal neurons from BACE1-transgenic mice compared to control mice (middle; Student’s t-test, triple asterisk indicates P <0.0001; BACE1 transgenic, n = 13 from three mice; WT, n = 14 from three mice). Mean conductance-voltage relationships and steady-state inactivation of sodium currents in hippocampal neurons from BACE1-transgenic and wild-type mice are shown on the right. (c) β2 cells, β2 + BACE1 clone 11 and β2 + BACE1 clone 28 were surface-biotinylated, captured, and analysed by western blot analysis using an anti-pan Nav1 α-subunit antibody. (d) Quantitative analysis of surface Nav1 α-subunit levels in β2 cells and β2 + BACE1 clone 11 (Student’s t-test, the asterisk indicates P <0.05; n = 3 for each cell type; the average surface level of Nav1 α-subunit in β2 cells is regarded as 1). (e) Surface-biotinylation of hippocampal slices acutely prepared from BACE1-transgenic and wild-type mice. Four matching slice pairs from similar locations of the brain were selected from BACE1-transgenic and wild-type mice, respectively (slice 1-4). Slices with same numbers are derived from similar brain sections of each mouse. Biotinylated surface Nav1.1 is captured and detected in hippocampal slices from both BACE1-transgenic and wild-type mice. (f) Quantitative analysis of surface Nav1.1 α-subunit levels in hippocampal slices from BACE1-transgenic and wild-type mice (Student’s t-test, asterisk indicates P <0.05; n = 4 for each genotype; the biotin-captured Nav1.1 α-subunit were normalized to total Nav1.1 α-subunit levels). (g) Punctate Nav1.1 staining largely colocalized with HSP70 proteins in immunofluorescence microscopy experiments. All error bars represent s.e.m.
Figure 7
Figure 7
Schematic representation showing BACE1-mediated regulation of Nav1. BACE1, followed by PS1-γ-secretase, cleavage promotes release of β2-ICD. β2-ICD, in turn, increases Nav1.1 α-subunit mRNA and protein levels. Elevated Nav1.1 accumulates inside cells while cell-surface Nav1 α-subunit levels are largely reduced.

Similar articles

Cited by

References

    1. Assal F, Cummings JL. Neuropsychiatric symptoms in the dementias. Curr. Opin. Neurol. 2002;15:445–450. - PubMed
    1. Mendez M, Lim G. Seizures in elderly patients with dementia: epidemiology and management. Drugs Aging. 2003;20:791–803. - PubMed
    1. Hesdorffer DC, Hauser WA, Annegers JF, Kokmen E, Rocca WA. Dementia and adult-onset unprovoked seizures. Neurology. 1996;46:727–730. - PubMed
    1. Hauser WA, Morris ML, Heston LL, Anderson VE. Seizures and myoclonus in patients with Alzheimer’s disease. Neurology. 1986;36:1226–1230. - PubMed
    1. Larner AJ, Doran M. Clinical phenotypic heterogeneity of Alzheimer’s disease associated with mutations of the presenilin-1 gene. J. Neurol. 2006;253:139–158. - PubMed

Publication types

MeSH terms