The relationships between the isoelectric point and: length of proteins, taxonomy and ecology of organisms
- PMID: 17565672
- PMCID: PMC1905920
- DOI: 10.1186/1471-2164-8-163
The relationships between the isoelectric point and: length of proteins, taxonomy and ecology of organisms
Abstract
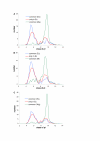
Background: The distribution of isoelectric point (pI) of proteins in a proteome is universal for all organisms. It is bimodal dividing the proteome into two sets of acidic and basic proteins. Different species however have different abundance of acidic and basic proteins that may be correlated with taxonomy, subcellular localization, ecological niche of organisms and proteome size.
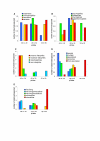
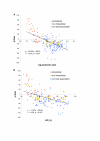
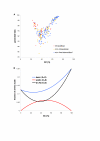
Results: We have analysed 1784 proteomes encoded by chromosomes of Archaea, Bacteria, Eukaryota, and also mitochondria, plastids, prokaryotic plasmids, phages and viruses. We have found significant correlation in more than 95% of proteomes between the protein length and pI in proteomes--positive for acidic proteins and negative for the basic ones. Plastids, viruses and plasmids encode more basic proteomes while chromosomes of Archaea, Bacteria, Eukaryota, mitochondria and phages more acidic ones. Mitochondrial proteomes of Viridiplantae, Protista and Fungi are more basic than Metazoa. It results from the presence of basic proteins in the former proteomes and their absence from the latter ones and is related with reduction of metazoan genomes. Significant correlation was found between the pI bias of proteomes encoded by prokaryotic chromosomes and proteomes encoded by plasmids but there is no correlation between eukaryotic nuclear-coded proteomes and proteomes encoded by organelles. Detailed analyses of prokaryotic proteomes showed significant relationships between pI distribution and habitat, relation to the host cell and salinity of the environment, but no significant correlation with oxygen and temperature requirements. The salinity is positively correlated with acidicity of proteomes. Host-associated organisms and especially intracellular species have more basic proteomes than free-living ones. The higher rate of mutations accumulation in the intracellular parasites and endosymbionts is responsible for the basicity of their tiny proteomes that explains the observed positive correlation between the decrease of genome size and the increase of basicity of proteomes. The results indicate that even conserved proteins subjected to strong selectional constraints follow the global trend in the pI distribution.
Conclusion: The distribution of pI of proteins in proteomes shows clear relationships with length of proteins, subcellular localization, taxonomy and ecology of organisms. The distribution is also strongly affected by mutational pressure especially in intracellular organisms.
Figures
Similar articles
-
Virtual 2D mapping of the viral proteome reveals host-specific modality distribution of molecular weight and isoelectric point.Sci Rep. 2021 Oct 28;11(1):21291. doi: 10.1038/s41598-021-00797-3. Sci Rep. 2021. PMID: 34711905 Free PMC article.
-
The molecular mass and isoelectric point of plant proteomes.BMC Genomics. 2019 Aug 5;20(1):631. doi: 10.1186/s12864-019-5983-8. BMC Genomics. 2019. PMID: 31382875 Free PMC article.
-
Global analysis of predicted proteomes: functional adaptation of physical properties.Proc Natl Acad Sci U S A. 2004 Jun 1;101(22):8390-5. doi: 10.1073/pnas.0307270101. Epub 2004 May 18. Proc Natl Acad Sci U S A. 2004. PMID: 15150418 Free PMC article.
-
Global organellar proteomics.Trends Biotechnol. 2003 Feb;21(2):82-8. doi: 10.1016/S0167-7799(02)00037-9. Trends Biotechnol. 2003. PMID: 12573857 Review.
-
Green systems biology - From single genomes, proteomes and metabolomes to ecosystems research and biotechnology.J Proteomics. 2011 Dec 10;75(1):284-305. doi: 10.1016/j.jprot.2011.07.010. Epub 2011 Jul 23. J Proteomics. 2011. PMID: 21802534 Review.
Cited by
-
Virtual 2-D map of the fungal proteome.Sci Rep. 2021 Mar 23;11(1):6676. doi: 10.1038/s41598-021-86201-6. Sci Rep. 2021. PMID: 33758316 Free PMC article.
-
Adaptation and convergence in circadian-related genes in Iberian freshwater fish.BMC Ecol Evol. 2021 Mar 8;21(1):38. doi: 10.1186/s12862-021-01767-z. BMC Ecol Evol. 2021. PMID: 33685402 Free PMC article.
-
Isoelectric points of multi-domain proteins.Bioinformation. 2007 Dec 5;2(3):101-4. doi: 10.6026/97320630002101. Bioinformation. 2007. PMID: 18292801 Free PMC article.
-
Genome-wide identification and characterization of multiple C2 domains and transmembrane region proteins in Gossypium hirsutum.BMC Genomics. 2020 Jun 29;21(1):445. doi: 10.1186/s12864-020-06842-1. BMC Genomics. 2020. PMID: 32600247 Free PMC article.
-
Protein charge determination and implications for interactions in cell extracts.Protein Sci. 2017 Feb;26(2):258-267. doi: 10.1002/pro.3077. Epub 2016 Dec 1. Protein Sci. 2017. PMID: 27813264 Free PMC article.
References
Publication types
MeSH terms
Substances
LinkOut - more resources
Full Text Sources
Research Materials
Miscellaneous

