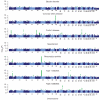
Genome-wide association study of 14,000 cases of seven common diseases and 3,000 shared controls
- PMID: 17554300
- PMCID: PMC2719288
- DOI: 10.1038/nature05911
Genome-wide association study of 14,000 cases of seven common diseases and 3,000 shared controls
Abstract
There is increasing evidence that genome-wide association (GWA) studies represent a powerful approach to the identification of genes involved in common human diseases. We describe a joint GWA study (using the Affymetrix GeneChip 500K Mapping Array Set) undertaken in the British population, which has examined approximately 2,000 individuals for each of 7 major diseases and a shared set of approximately 3,000 controls. Case-control comparisons identified 24 independent association signals at P < 5 x 10(-7): 1 in bipolar disorder, 1 in coronary artery disease, 9 in Crohn's disease, 3 in rheumatoid arthritis, 7 in type 1 diabetes and 3 in type 2 diabetes. On the basis of prior findings and replication studies thus-far completed, almost all of these signals reflect genuine susceptibility effects. We observed association at many previously identified loci, and found compelling evidence that some loci confer risk for more than one of the diseases studied. Across all diseases, we identified a large number of further signals (including 58 loci with single-point P values between 10(-5) and 5 x 10(-7)) likely to yield additional susceptibility loci. The importance of appropriately large samples was confirmed by the modest effect sizes observed at most loci identified. This study thus represents a thorough validation of the GWA approach. It has also demonstrated that careful use of a shared control group represents a safe and effective approach to GWA analyses of multiple disease phenotypes; has generated a genome-wide genotype database for future studies of common diseases in the British population; and shown that, provided individuals with non-European ancestry are excluded, the extent of population stratification in the British population is generally modest. Our findings offer new avenues for exploring the pathophysiology of these important disorders. We anticipate that our data, results and software, which will be widely available to other investigators, will provide a powerful resource for human genetics research.
Figures


Comment in
-
Genomics: guilt by association.Nature. 2007 Jun 7;447(7145):645-6. doi: 10.1038/447645a. Nature. 2007. PMID: 17554292 No abstract available.
-
Genome-wide association study of susceptibility alleles for coronary artery disease.Curr Atheroscler Rep. 2008 Jun;10(3):183-5. doi: 10.1007/s11883-008-0029-8. Curr Atheroscler Rep. 2008. PMID: 18489844 No abstract available.
-
In Retrospect: A decade of shared genomic associations.Nature. 2017 Jun 14;546(7658):360-361. doi: 10.1038/546360a. Nature. 2017. PMID: 28617469 No abstract available.
Similar articles
-
Genomics: guilt by association.Nature. 2007 Jun 7;447(7145):645-6. doi: 10.1038/447645a. Nature. 2007. PMID: 17554292 No abstract available.
-
Consensus Genome-Wide Expression Quantitative Trait Loci and Their Relationship with Human Complex Trait Disease.OMICS. 2016 Jul;20(7):400-14. doi: 10.1089/omi.2016.0063. OMICS. 2016. PMID: 27428252 Free PMC article.
-
Sex-specific differences in effect size estimates at established complex trait loci.Int J Epidemiol. 2012 Oct;41(5):1376-82. doi: 10.1093/ije/dys104. Epub 2012 Jul 23. Int J Epidemiol. 2012. PMID: 22825589 Free PMC article.
-
New IBD genetics: common pathways with other diseases.Gut. 2011 Dec;60(12):1739-53. doi: 10.1136/gut.2009.199679. Epub 2011 Feb 7. Gut. 2011. PMID: 21300624 Review.
-
Genome-wide association scans identify multiple confirmed susceptibility loci for Crohn's disease: lessons for study design.Inflamm Bowel Dis. 2007 Dec;13(12):1554-60. doi: 10.1002/ibd.20239. Inflamm Bowel Dis. 2007. PMID: 17712840 Review.
Cited by
-
Ancestry and genome-wide association study of domestic pigs that survive African swine fever in Uganda.Trop Anim Health Prod. 2024 Oct 29;56(8):366. doi: 10.1007/s11250-024-04195-5. Trop Anim Health Prod. 2024. PMID: 39467944 Free PMC article.
-
Epi-SSA: A novel epistasis detection method based on a multi-objective sparrow search algorithm.PLoS One. 2024 Oct 24;19(10):e0311223. doi: 10.1371/journal.pone.0311223. eCollection 2024. PLoS One. 2024. PMID: 39446852 Free PMC article.
-
HBI: a hierarchical Bayesian interaction model to estimate cell-type-specific methylation quantitative trait loci incorporating priors from cell-sorted bisulfite sequencing data.Genome Biol. 2024 Oct 15;25(1):273. doi: 10.1186/s13059-024-03411-7. Genome Biol. 2024. PMID: 39407252 Free PMC article.
-
Powerful mapping of cis-genetic effects on gene expression across diverse populations reveals novel disease-critical genes.medRxiv [Preprint]. 2024 Sep 26:2024.09.25.24314410. doi: 10.1101/2024.09.25.24314410. medRxiv. 2024. PMID: 39399015 Free PMC article. Preprint.
-
Intestinal Epithelial PTPN2 Limits Pathobiont Colonization by Immune-Directed Antimicrobial Responses.bioRxiv [Preprint]. 2024 Sep 26:2024.09.24.614848. doi: 10.1101/2024.09.24.614848. bioRxiv. 2024. PMID: 39386684 Free PMC article. Preprint.
References
-
- Spitzer RL, Endicott J, Robins E. Research diagnostic criteria: rationale and reliability. Arch. Gen. Psychiatry. 1978;35:773–782. - PubMed
-
- Wing JKBT, et al. SCAN. Schedules for Clinical Assessment in Neuropsychiatry. Arch. Gen. Psychiatry. 1990;47:589–593. - PubMed
-
- Craddock M, et al. Concurrent validity of the OPCRIT diagnostic system. Comparison of OPCRIT diagnoses with consensus best-estimate lifetime diagnoses. Br. J. Psychiatry. 1996;169:58–63. - PubMed
-
- McGuffin P, Farmer A, Harvey I. A polydiagnostic application of operational criteria in studies of psychotic illness. Development and reliability of the OPCRIT system. Arch. Gen. Psychiatry. 1991;48:764–770. - PubMed
-
- Green EK, et al. Operation of the schizophrenia susceptibility gene, neuregulin 1, across traditional diagnostic boundaries to increase risk for bipolar disorder. Arch. Gen. Psychiatry. 2005;62:642–648. - PubMed
Publication types
MeSH terms
Substances
Associated data
- Actions
- Actions
Grants and funding
- G9806740/MRC_/Medical Research Council/United Kingdom
- G0600329/MRC_/Medical Research Council/United Kingdom
- G0800759/MRC_/Medical Research Council/United Kingdom
- 077011/WT_/Wellcome Trust/United Kingdom
- G0000934/MRC_/Medical Research Council/United Kingdom
- 076113/WT_/Wellcome Trust/United Kingdom
- G0600705/MRC_/Medical Research Council/United Kingdom
- 090532/WT_/Wellcome Trust/United Kingdom
- G0100594/MRC_/Medical Research Council/United Kingdom
- WT_/Wellcome Trust/United Kingdom
- G90/106/MRC_/Medical Research Council/United Kingdom
- G19/9/MRC_/Medical Research Council/United Kingdom
- CZB/4/540/CSO_/Chief Scientist Office/United Kingdom
- G9810900/MRC_/Medical Research Council/United Kingdom
- G0501942/MRC_/Medical Research Council/United Kingdom
- G0901461/MRC_/Medical Research Council/United Kingdom
LinkOut - more resources
Full Text Sources
Other Literature Sources
Medical
Molecular Biology Databases
Research Materials

