. 2007 Jun 20;26(12):2933-41.
doi: 10.1038/sj.emboj.7601733. Epub 2007 May 24.

ATMIN defines an NBS1-independent pathway of ATM signalling

Affiliations

ATMIN defines an NBS1-independent pathway of ATM signalling

Nnennaya Kanu et al. EMBO J. .

Abstract

The checkpoint kinase ATM (ataxia telangiectasia mutated) transduces genomic stress signals to halt cell cycle progression and promote DNA repair in response to DNA damage. Here, we report the characterisation of an essential cofactor for ATM, ATMIN (ATM INteracting protein). ATMIN interacts with ATM through a C-terminal motif, which is also present in Nijmegen breakage syndrome (NBS)1. ATMIN and ATM co-localised in response to ATM activation by chloroquine and hypotonic stress, but not after induction of double-strand breaks by ionising radiation (IR). ATM/ATMIN complex disruption by IR was attenuated in cells with impaired NBS1 function, suggesting competition of NBS1 and ATMIN for ATM binding. ATMIN protein levels were reduced in ataxia telangiectasia cells and ATM protein levels were low in primary murine fibroblasts lacking ATMIN, indicating reciprocal stabilisation. Whereas phosphorylation of Smc1, Chk2 and p53 was normal after IR in ATMIN-deficient cells, basal ATM activity and ATM activation by hypotonic stress and inhibition of DNA replication was impaired. Thus, ATMIN defines a novel NBS1-independent pathway of ATM signalling.


Figures
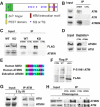
Figure 1
Figure 1
ATMIN interacts with ATM. (A) Schematic representation of the ATMIN protein. Approximate regions of ATMIN encoding Zn2+ fingers are indicated by green boxes, the PEST domain as a yellow box, the ATM interaction motif as a red box, SQ/TQ motifs as blue stars. (B) ATMIN immunoprecipitation (IP) was performed with HCT116 cell lysates followed by immunoblotting with antibodies specific for ATM, ATR and ATMIN. (C) HEK 293T cells were transfected with FLAG-tagged wild-type ATM (WT) or FLAG-tagged kinase-dead ATM (KD), ATMIN IP was performed, followed by immunoblotting with FLAG and ATMIN-specific antibodies. (D) HEK 293T cell protein extracts were depleted of ATMIN protein or control depleted, followed by immunoblotting with ATMIN- and ATM-specific antibodies. (E) Alignment of the ATM interaction motifs of human NBS1, human ATMIN and zebrafish ATMIN. Amino acids are coloured according to biochemical properties (hydrophobic, blue; acidic, purple; basic, red; polar, green). (F) FLAG IP was performed on HEK 293T cell lysates transfected with control vector, FLAG-tagged wild-type ATMIN or ATMINΔAim, followed by immunoblotting with FLAG- and P-S1981-ATM-specific antibodies. (G) HEK 293T cells were irradiated with 5 Gy or mock treated, ATM IP was performed, followed by immunoblotting with ATMIN and ATM antibodies. (H) HEK 293T cells were treated with 25 μg/ml chloroquine (4 h) or mock treated, ATMIN or control IP was performed, followed by immunoblotting with ATMIN and ATM antibodies.
Figure 2
Figure 2
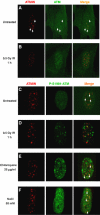
ATMIN colocalises with ATM after chloroquine and hypotonic treatment, but not after IR. (A, B) Double-immunostaining for ATMIN (red), ATM (green) and merge of ATM/ATMIN in either untreated IMR90 fibroblasts (A) or 1 h after treatment with 0.5 Gy IR (B). White arrows indicate sites of ATM/ATMIN colocalisation. (CF) Double-immunostaining for ATMIN (red), phosphorylated ATM (P-S1981-ATM; green) and merge in untreated IMR90 primary fibroblasts (C), or 1 h after treatment with 0.5 Gy IR (D), after 4 h with 25 μg/ml chloroquine (E) or 1 h with 50 mM NaCl (F). White arrows indicate sites of P-S1981-ATM/ATMIN colocalisation.
Figure 3
Figure 3
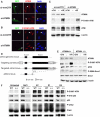
ATMIN/ATM colocalisation after IR in NBS1-deficient cells. (A–F), Double-immunostaining for phosphorylated ATM (P-S1981-ATM; green) with either phosphorylated histone H2AX (γH2AX; red) or ATMIN (red) was performed in NBS1-deficient cells complemented with wild-type NBS1 (NBS1−/− +wt NBS1; (A, B)), empty vector (NBS1−/− +vector; (C, D)) or a C-terminally truncated form a NBS1 (NBS1−/− +ΔC NBS1; (E, F)) after treatment with 0.2 Gy IR for 5 min. White arrows indicate sites of P-S1981-ATM/ATMIN colocalisation, yellow arrowheads in (D) indicate P-S1981-ATM staining not colocalising with ATMIN.
Figure 4
Figure 4
ATM augments ATMIN protein levels. (A) Protein lysates isolated from HEK 293T cells treated with proteasome inhibitor or mock treated for 6 h were analysed by immunoblotting with ATMIN and β-actin-specific antibodies. (B) HEK 293T cells were transfected with FLAG-tagged ATMIN, treated with proteasome inhibitor for 6 h or mock treated, followed by immunoblotting with FLAG-tag and β-actin-specific antibodies. (C) HEK 293T cells were transfected with GFP-tagged ATMIN or a C-terminal truncation of ATMIN (GFP-ATMINΔC), treated with anisomycin (5 μM) for 6 h or mock treated, followed by immunoblotting with GFP and β-actin-specific antibodies. (D) Protein lysates isolated from A-T cells, Seckel syndrome cells and respective control cells were analysed by immunoblotting with ATMIN and β-actin-specific antibodies. (E) HEK 293T cells were transfected with siRNA pools directed against ATM or control pools, proteasome inhibitor or mock treated, and ATM, ATMIN and β-actin protein levels were analysed. (F) A-T cells were co-transfected with GFP expression vector and FLAG-tagged ATM (ATM/GFP) or with GFP and empty control vector, (vector/GFP). GFP fluorescence, ATMIN immunostaining (red) and DAPI staining is shown. White arrows indicate transfected cells.
Figure 5
Figure 5
ATMIN is required for ATM protein expression and function. (A, B) IMR90 cells were co-transfected with GFP and a pSUPER vector expressing a shRNA specific for ATMIN (si-ATMIN) or with GFP and a pSUPER vector expressing a mismatched shRNA (si-mmCTR), and processed for IF 30 min after treatment with 5 Gy IR. Two different siRNAs targeting ATMIN gave similar results. Immunostaining for ATMIN (A), P-S1981-ATM (B), is shown together with GFP fluorescence. White arrowheads indicate transfected cells. (C) HEK 293T cells were transfected with vectors expressing either si-ATMIN or si-mmCTR. 48 h after transfection cells were treated with 5 Gy IR (1 h), 25 μg/ml chloroquine (Chl; 4 h) or mock treated and expression of the indicated protein was determined by Western blot analysis. (D) Schematic representation of the atmin genomic locus, the targeting construct, the targeted atmin locus, and the targeted atmin locus after cre-mediated recombination (atminΔ). Exons are represented by black rectangles, intronic DNA is shown as a black line. LoxP sites are indicated by triangles, FRT sites as hatched rectangles. DTα, diphtheria toxin α chain; NeoR, Neomycin resistance gene. (E) atmin+/+ and atminΔ/Δ MEFs were treated with 5 Gy IR (1 h), 25 μg/ml chloroquine (Chl; 4 h) or mock treated and expression of the indicated protein was determined by Western blot analysis. (F) atmin+/+ and atminΔ/Δ MEFs were treated with 2 mM HU for 2 h, hypotonic salt (50 mM NaCl) for 1 h, 50 J m−2 UV (harvested after 3 h), 1 Gy IR (harvested after 15 min) or mock treated and expression of the indicated protein was determined by Western blot analysis.
Figure 6
Figure 6
Models illustrating interaction of ATMIN and NBS1 with ATM. (A) atmin+/+ and atminΔ/Δ MEFs were treated with colcimid (1 μg/ml), and were exposed to 10 Gy of IR or mock treated. At 20 h after irradiation, the percentage of cells that were in M phase was determined by staining for phospho-histone H3. (B) atmin+/+ and atminΔ/Δ MEFs were treated with the indicated doses of IR and cell viability was determined by trypan blue exclusion. (C) atmin+/+ and atminΔ/Δ MEFs were treated with the indicated doses of chloroquine and cell viability was determined by trypan blue exclusion. (D) Model of NBS1 and ATMIN functions in response to ATM activation by IR and hypotonic shock.

Similar articles

Cited by

References

    1. Alderton GK, Joenje H, Varon R, Borglum AD, Jeggo PA, O'Driscoll M (2004) Seckel syndrome exhibits cellular features demonstrating defects in the ATR-signalling pathway. Hum Mol Genet 13: 3127–3138 - PubMed
    1. Bakkenist CJ, Kastan MB (2003) DNA damage activates ATM through intermolecular autophosphorylation and dimer dissociation. Nature 421: 499–506 - PubMed
    1. Bakkenist CJ, Kastan MB (2004) Initiating cellular stress responses. Cell 118: 9–17 - PubMed
    1. Behrens A, Sibilia M, David JP, Mohle-Steinlein U, Tronche F, Schutz G, Wagner EF (2002) Impaired postnatal hepatocyte proliferation and liver regeneration in mice lacking c-jun in the liver. EMBO J 21: 1782–1790 - PMC - PubMed
    1. Behrens A, Sibilia M, Wagner EF (1999) Amino-terminal phosphorylation of c-Jun regulates stress-induced apoptosis and cellular proliferation. Nat Genet 21: 326–329 - PubMed

Publication types