. 2007;35(11):3723-32.
doi: 10.1093/nar/gkm314. Epub 2007 May 21.

Regulation of glutamate receptor B pre-mRNA splicing by RNA editing

Affiliations

Regulation of glutamate receptor B pre-mRNA splicing by RNA editing

Vera K Schoft et al. Nucleic Acids Res. 2007.

Abstract

RNA-editing enzymes of the ADAR family convert adenosines to inosines in double-stranded RNA substrates. Frequently, editing sites are defined by base-pairing of the editing site with a complementary intronic region. The glutamate receptor subunit B (GluR-B) pre-mRNA harbors two such exonic editing sites termed Q/R and R/G. Data from ADAR knockout mice and in vitro editing assays suggest an intimate connection between editing and splicing of GluR-B pre-mRNA. By comparing the events at the Q/R and R/G sites, we can show that editing can both stimulate and repress splicing efficiency. The edited nucleotide, but not ADAR binding itself, is sufficient to exert this effect. The presence of an edited nucleotide at the R/G site reduces splicing efficiency of the adjacent intron facilitating alternative splicing events occurring downstream of the R/G site. Lack of editing inhibits splicing at the Q/R site. Editing of both the Q/R nucleotide and an intronic editing hotspot are required to allow efficient splicing. Inefficient intron removal may ensure that only properly edited mRNAs become spliced and exported to the cytoplasm.


Figures
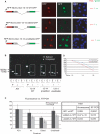
Figure 1.
Figure 1.
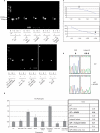
Analysis of splicing efficiencies of wild-type and mutant R/G constructs. (A). Microscopic images of HeLa cells transfected with wild-type, ‘pre-edited’, and uneditable R/G constructs. The constructs are indicated next to each picture series. RFP and GFP fluorescence is shown in red and green, respectively. DNA is stained with DAPI (blue). A ‘pre-edited’ R/G shows reduced fluorescence in the GFP channel when compared to wild-type or uneditable R/G constructs, suggesting impaired splicing efficiency. Scale bar: 10 µm. (B) RT-PCR analysis of cells transfected with Ad1, wild-type R/G, ‘pre-edited’ R/G, and uneditable R/G fragments. Exonic (E) and intronic (I) primers were used to selectively amplify spliced and unspliced products. Arrow: PCR product derived from the spliced product; Arrowhead: PCR product derived from the unspliced product. Constructs are indicated below the respective lanes. P: plasmid positive control; +: with RTase; −: without RTase. To allow quantification of PCR products and to avoid saturation of the PCR reactions, only 23 cycles were run. The high molecular band obtained with exonic primers in the pre-edited construct reflects the unspliced primary RNA and results from the poor splicing of this construct. (C) Bar diagram representing the averaged results of 3 RT-PCR experiments (light gray bars) and 100 fluorescent cells analyzed by quantitative microscopy (dark bars). In both assays, a ‘pre-edited’ R/G-containing fragment (edited) showed reduced splicing. Splicing efficiency of Ad1 was set to 100%. A student's t-test indicates that the observed differences are significant (P-value < 0.05). (D) Quantified band intensities of RT-PCRs with different DNA dilutions are plotted. The linear relationship between the different DNA dilutions are shown for each primer pair. A 1:4 dilution was used for the RT-PCR in (B).
Figure 2.
Figure 2.
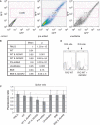
FACS analysis of R/G constructs transfected into HEK293 cells. (A) 2D plot of untransfected cells (control), cells transfected with a vector containing exons 13 through 14 including the R/G site in a pre edited, and uneditable state. Constitutive red fluorescence is plotted along the y-axis while green fluorescence (only visible after successful splicing) is plotted along the x-axis. Only cells expressing solid RFP expression were chosen and gated for further analysis. (B) Red to green fluorescence ratios of individual cells in the gated window shown in (A) were calculated. The mean of these ratios is given. For clarity, the mean fluorescence ratio of cells transfected with ‘empty vector’ (RNLG) was set to 1. Wild-type and mutant R/G constructs spanning exons 13 through 14, and plasmids expressing ADAR1 or ADAR2 are shown. A ‘pre-edited’ R/G construct and a wild-type construct cotransfected with ADAR2 are weakly spliced. However, a construct where ADAR can bind but is unable to edit (binding but no editing +ADAR2) showed GFP fluorescence comparable to the wild-type construct, indicating that an inosine at the R/G site and not ADAR binding is responsible for splice suppression. Student's t-test P-values indicate that populations of transfected cells differed significantly from cells transfected with the wild-type construct with the exception of cells transfected with the construct that could be bound but not edited by ADAR2 (BNE). (C) Bar diagram and SD of RFP:GFP fluorescence ratios shown in (B). (D) Cotransfection of ADAR2 results in editing of GluR-B at the R/G site. Sequencing of RT-PCR products revealed that wild-type R/G fragments display no G peak at the R/G site whereas cotransfection of ADAR 2 results in editing. The R/G site is marked by an arrow.
Figure 3.
Figure 3.
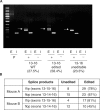
Erroneous splicing and editing. (A) RT-PCR analysis of HeLa cells transfected with constructs expressing exons 13–16 with the R/G site in wild-type, ‘pre-edited’, and uneditable conformation. Exon (E) and intron (I) containing primers were used. Properly spliced products in both the flip and flop conformation run at equal height and are labeled by an arrow. An erroneously spliced product (exons 13–16/lower band) is most abundant in cells transfected with the wild-type and uneditable R/G constructs. The ‘pre-edited’ fragment was mainly spliced correctly. Constructs are indicated below the respective lanes. P: plasmid; +: with RTase; −: without RTase. The percentage of properly spliced product to total spliced product is indicated underneath each PCR reaction. (B) GluR-B cDNAs were amplified from two different mouse brains, cloned and sequenced individually. No clear correlation was observed between editing and alternative exon choice in mouse A. In mouse B, in contrast, a correlation between editing and splicing in the flip conformation can be observed. Given this variability amongst different mice, it seems that RNA editing and alternative exon choice are functionally unrelated.
Figure 4.
Figure 4.
Analysis of splice efficiencies of wt and mutated Q/R constructs.(A). RT-PCR of Q/R constructs transfected into HEK293 cells using 25 cycles, in the presence (+) or absence (−) of reverse transcriptase. The strongest signal is visible when the Q/R site and the intronic editing hotspot are edited concomitantly. The constructs are indicated below the respective lanes. E: exonic primer pair, spliced product. I: intronic primer pair, unspliced product. Arrows point to the spliced (upper arrow) and unspliced (lower arrow) PCR product, respectively. (A) Shorter exposure of two selected constructs, demonstrating that the PCR reactions with intronic primers have not yet reached stationary phase. (B) Calculated splicing efficiencies of three RT-PCR analysis are plotted in a graph. Band intensities were normalized for PCR product size and the relative splicing efficiencies were calculated as ratios of the splice product versus spliced plus unspliced. Note that the diminutive value for splicing efficiencies is due to the strong intronic signal. Co-transfection of wt Q/R with ADAR2, or a construct that is ‘pre-edited’ at both the Q/R site and the hotspot 2 spliced best. Editing at the Q/R site alone, deletion of the ECS, or a compensatory mutation only moderately altered splicing efficiency. Student's t-test indicates that the increase in splice efficiency upon cotranfection of ADAR2 or pre-editing of the Q/R site and hotspot 2 is significant. (C) Quantified band intensities of RT-PCRs with different DNA dilutions are plotted in the graphs. The linear relationship between the different DNA dilutions are shown for each primer pair. Arrows indicate the DNA dilution which was used for the RT-PCR in (A). Differing DNA dilutions for the exonic and intronic primer pairs were considered in the calculations for splicing efficiencies. (D) Co-transfection of ADAR2 results in editing of GluR-B at the Q/R site and the hotspot 2. The editing sites are indicated by arrows.
Figure 5.
Figure 5.
Regulation of splicing by editing in GluR-B pre-mRNA. At the Q/R site, editing of the Q/R base and an intronic hotspot is required for efficient splicing. A double-stranded structure is potentially resolved at the Q/R site, while a splice repressor is inactivated at the intronic editing hotspot 2. The edited nucleotides are sufficient to stimulate splicing. Editing at the R/G site represses splicing and enhances proper alternative splicing. An edited nucleotide at the R/G site is sufficient to suppress splicing. ADAR binding is not required.

Similar articles

Cited by

References

    1. Chervitz SA, Aravind L, Sherlock G, Ball CA, Koonin EV, Dwight SS, Harris MA, Dolinski K, Mohr S, et al. Comparison of the complete protein sets of worm and yeast: orthology and divergence. Science. 1998;282:2022–2028. - PMC - PubMed
    1. Roy SW, Gilbert W. The evolution of spliceosomal introns: patterns, puzzles and progress. Nat. Rev. Genet. 2006;7:211–221. - PubMed
    1. Bass BL. RNA editing by adenosine deaminases that act on RNA. Annu. Rev. Biochem. 2002;71:817–846. - PMC - PubMed
    1. Pillai RS. MicroRNA function: multiple mechanisms for a tiny RNA? RNA. 2005;11:1753–1761. - PMC - PubMed
    1. Wagner RW, Yoo C, Wrabetz L, Kamholz J, Buchhalter J, Hassan NF, Khalili K, Kim SU, Perussia B, et al. Double-stranded RNA unwinding and modifying activity is detected ubiquitously in primary tissues and cell lines. Mol. Cell. Biol. 1990;10:5586–5590. - PMC - PubMed

Publication types