

Three distinct modes of intron dynamics in the evolution of eukaryotes
- PMID: 17495008
- PMCID: PMC1899114
- DOI: 10.1101/gr.6438607
Three distinct modes of intron dynamics in the evolution of eukaryotes
Abstract
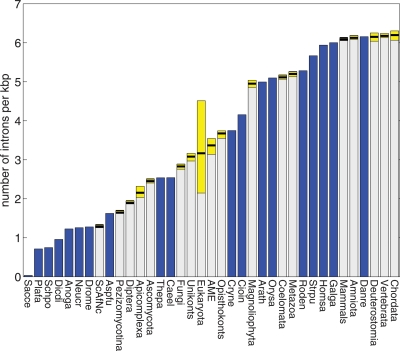
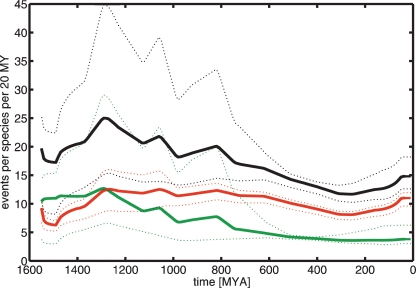
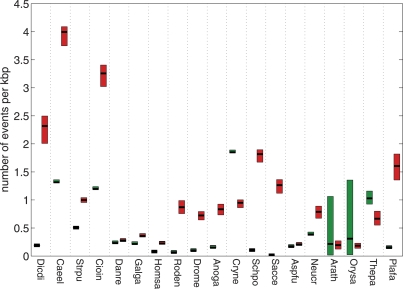
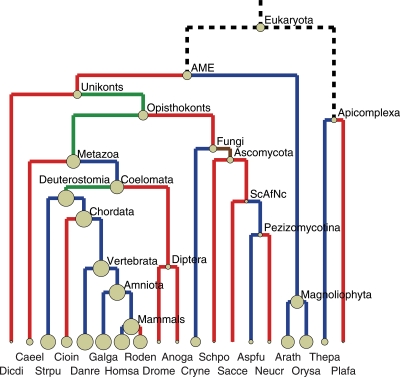
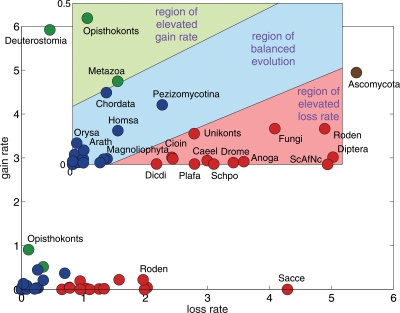
Several contrasting scenarios have been proposed for the origin and evolution of spliceosomal introns, a hallmark of eukaryotic genes. A comprehensive probabilistic model to obtain a definitive reconstruction of intron evolution was developed and applied to 391 sets of conserved genes from 19 eukaryotic species. It is inferred that a relatively high intron density was reached early, i.e., the last common ancestor of eukaryotes contained >2.15 introns/kilobase, and the last common ancestor of multicellular life forms harbored approximately 3.4 introns/kilobase, a greater intron density than in most of the extant fungi and in some animals. The rates of intron gain and intron loss appear to have been dropping during the last approximately 1.3 billion years, with the decline in the gain rate being much steeper. Eukaryotic lineages exhibit three distinct modes of evolution of the intron-exon structure. The primary, balanced mode, apparently, operates in all lineages. In this mode, intron gain and loss are strongly and positively correlated, in contrast to previous reports on inverse correlation between these processes. The second mode involves an elevated rate of intron loss and is prevalent in several lineages, such as fungi and insects. The third mode, characterized by elevated rate of intron gain, is seen only in deep branches of the tree, indicating that bursts of intron invasion occurred at key points in eukaryotic evolution, such as the origin of animals. Intron dynamics could depend on multiple mechanisms, and in the balanced mode, gain and loss of introns might share common mechanistic features.
Figures
Similar articles
-
Whence genes in pieces: reconstruction of the exon-intron gene structures of the last eukaryotic common ancestor and other ancestral eukaryotes.Wiley Interdiscip Rev RNA. 2013 Jan-Feb;4(1):93-105. doi: 10.1002/wrna.1143. Epub 2012 Nov 8. Wiley Interdiscip Rev RNA. 2013. PMID: 23139082 Review.
-
The role of reverse transcriptase in intron gain and loss mechanisms.Mol Biol Evol. 2012 Jan;29(1):179-86. doi: 10.1093/molbev/msr192. Epub 2011 Jul 29. Mol Biol Evol. 2012. PMID: 21804076
-
Prevalence of intron gain over intron loss in the evolution of paralogous gene families.Nucleic Acids Res. 2004 Jul 14;32(12):3724-33. doi: 10.1093/nar/gkh686. Print 2004. Nucleic Acids Res. 2004. PMID: 15254274 Free PMC article.
-
Rates of intron loss and gain: implications for early eukaryotic evolution.Proc Natl Acad Sci U S A. 2005 Apr 19;102(16):5773-8. doi: 10.1073/pnas.0500383102. Epub 2005 Apr 12. Proc Natl Acad Sci U S A. 2005. PMID: 15827119 Free PMC article.
-
Analysis of evolution of exon-intron structure of eukaryotic genes.Brief Bioinform. 2005 Jun;6(2):118-34. doi: 10.1093/bib/6.2.118. Brief Bioinform. 2005. PMID: 15975222 Review.
Cited by
-
Large-scale comparative analysis of splicing signals and their corresponding splicing factors in eukaryotes.Genome Res. 2008 Jan;18(1):88-103. doi: 10.1101/gr.6818908. Epub 2007 Nov 21. Genome Res. 2008. PMID: 18032728 Free PMC article.
-
Evaluation of the mechanisms of intron loss and gain in the social amoebae Dictyostelium.BMC Evol Biol. 2015 Dec 18;15:286. doi: 10.1186/s12862-015-0567-y. BMC Evol Biol. 2015. PMID: 26678305 Free PMC article.
-
Origin and evolution of spliceosomal introns.Biol Direct. 2012 Apr 16;7:11. doi: 10.1186/1745-6150-7-11. Biol Direct. 2012. PMID: 22507701 Free PMC article. Review.
-
The function of introns.Front Genet. 2012 Apr 13;3:55. doi: 10.3389/fgene.2012.00055. eCollection 2012. Front Genet. 2012. PMID: 22518112 Free PMC article.
-
A Nonstationary Markov Model Detects Directional Evolution in Hymenopteran Morphology.Syst Biol. 2015 Nov;64(6):1089-103. doi: 10.1093/sysbio/syv052. Epub 2015 Aug 12. Syst Biol. 2015. PMID: 26272507 Free PMC article.
References
-
- Aguinaldo A.M., Turbeville J.M., Linford L.S., Rivera M.C., Garey J.R., Raff R.A., Lake J.A., Turbeville J.M., Linford L.S., Rivera M.C., Garey J.R., Raff R.A., Lake J.A., Linford L.S., Rivera M.C., Garey J.R., Raff R.A., Lake J.A., Rivera M.C., Garey J.R., Raff R.A., Lake J.A., Garey J.R., Raff R.A., Lake J.A., Raff R.A., Lake J.A., Lake J.A. Evidence for a clade of nematodes, arthropods and other moulting animals. Nature. 1997;387:489–493. - PubMed
-
- Baldauf S.L. The deep roots of eukaryotes. Science. 2003;300:1703–1706. - PubMed
-
- Carmel L., Rogozin I.B., Wolf Y.I., Koonin E.V., Rogozin I.B., Wolf Y.I., Koonin E.V., Wolf Y.I., Koonin E.V., Koonin E.V. An expectation-maximization algorithm for analysis of evolution of exon–intron structure of eukaryotic genes Comparative Genomics. Lect. Notes Comput. Sci. 2005;3678:35–46.
Publication types
MeSH terms
LinkOut - more resources
Full Text Sources