. 2007 May;12(5):807-16.
doi: 10.1016/j.devcel.2007.02.002.

Role of mitochondrial remodeling in programmed cell death in Drosophila melanogaster

Affiliations

Role of mitochondrial remodeling in programmed cell death in Drosophila melanogaster

Gaurav Goyal et al. Dev Cell. 2007 May.

Abstract

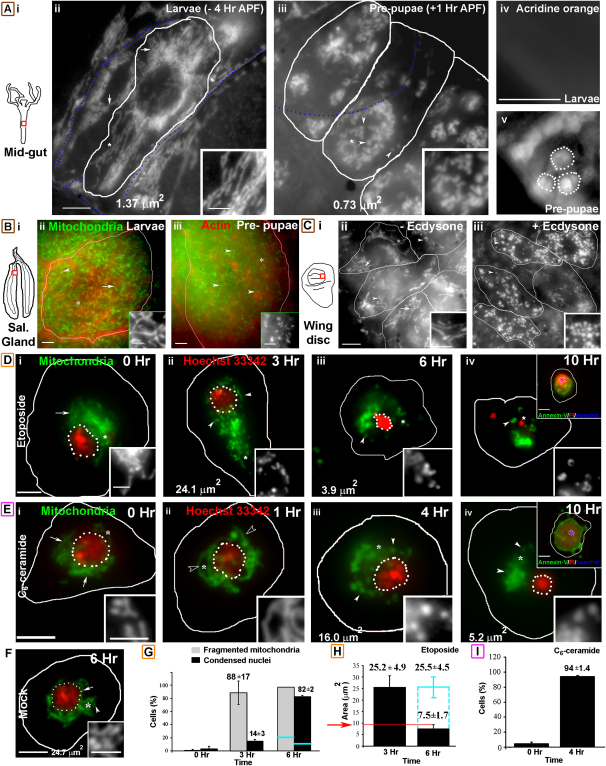
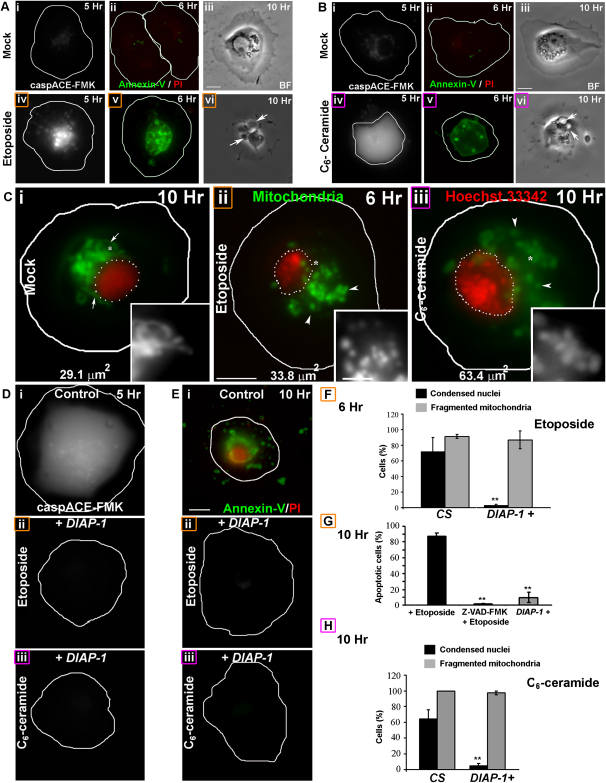
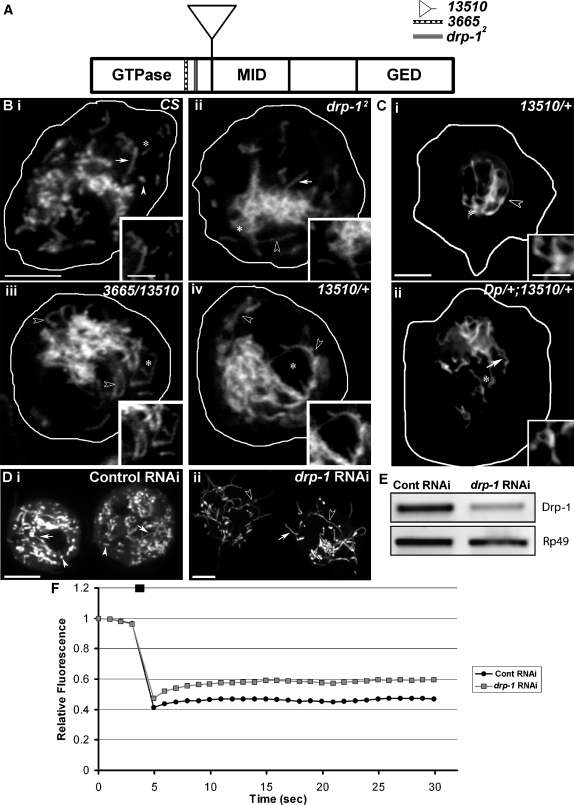
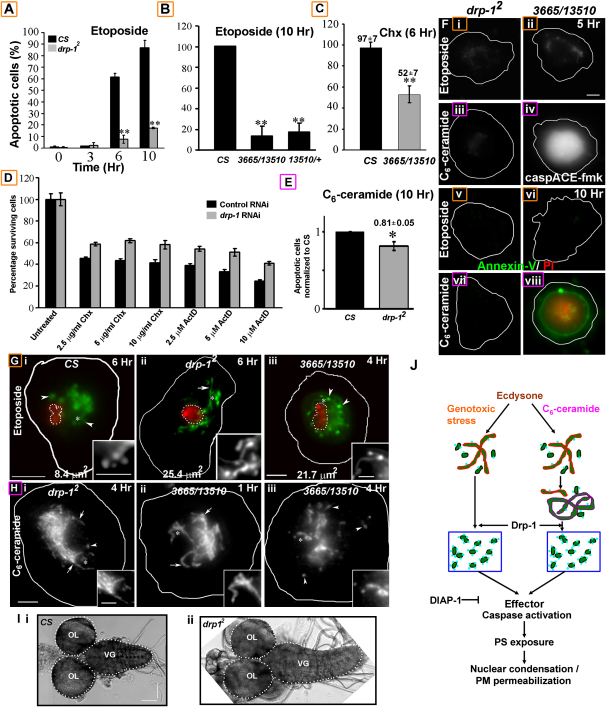
The role of mitochondria in Drosophila programmed cell death remains unclear, although certain gene products that regulate cell death seem to be evolutionarily conserved. We find that developmental programmed cell death stimuli in vivo and multiple apoptotic stimuli ex vivo induce dramatic mitochondrial fragmentation upstream of effector caspase activation, phosphatidylserine exposure, and nuclear condensation in Drosophila cells. Unlike genotoxic stress, a lipid cell death mediator induced an increase in mitochondrial contiguity prior to fragmentation of the mitochondria. Using genetic mutants and RNAi-mediated knockdown of drp-1, we find that Drp-1 not only regulates mitochondrial fission in normal cells, but mediates mitochondrial fragmentation during programmed cell death. Mitochondria in drp-1 mutants fail to fragment, resulting in hyperplasia of tissues in vivo and protection of cells from multiple apoptotic stimuli ex vivo. Thus, mitochondrial remodeling is capable of modifying the propensity of cells to undergo death in Drosophila.


Figures

Figure 1
Figure 1
Mitochondria Underwent Fragmentation during PCD (A–C) (i) Regions (red squares) of Drosophila third-instar larval (A) midgut, (B) salivary gland, or (C) wing imaginal disc that were imaged. (A) Mitochondria in (ii) Mito-GFP larval and (iii) prepupal midgut cells (outlined) with the average CSA indicated. Acridine orange staining of (iv) larval or (v) prepupal midgut cells revealed positive nuclei (outlined in [v]) in prepupal cells. Blue, dotted lines mark trachea. (Bii–Biii) Mitochondria (green) in (ii) third-instar larval or (iii) prepupal salivary gland cells (outlined; A568 Phalloidin [red]). (Cii–Ciii) Mitochondria in wing disc cells (outlined) incubated for 2 hr with (iii) ecdysone or (ii) mock. (D–F) Mitochondrial morphology (green) and nuclear morphology (Hoechst-33342 [D]–[F]; red, dotted outline) in hemocytes incubated with (D) 10 μM etoposide, (E) 20 μM C6-ceramide, or (F) mock for indicated times. The nuclear CSA in the hemocyte shown is indicated. Top insets show cells positive for FITC-Annexin V (AnV, green) and PI (red) with highly condensed nuclei (Hoechst-33342; blue, dotted outline) at 10 hr. (G) Histogram showing the fraction of etoposide- or mock-treated (blue line) hemocytes (n = 100) with fragmented mitochondria (gray) or apoptotic nuclei (black) at specified times (mean ± SD; n = 2). (H) Nuclear CSA in etoposide- (black) or mock-treated (blue) hemocytes showed condensed nuclei (CSA < 10 μm2) in AnV-positive cells (6 hr). (I) Histogram showing the number of C6-ceramide-treated hemocytes that had fragmented mitochondria at indicated times (mean ± SD; n = 2). Lower insets show a magnified view of the region marked with an asterisk. Arrows, arrowheads, and open arrowheads indicate tubular, fragmented, and extensively tubular mitochondria, respectively. The panel label of cells exposed to ecdysone, genotoxic stress, or ceramide has been outlined brown, orange, or pink, respectively. The scale bars in the panels are 5 μm; those in the top insets of the panel are 5 μm, and those in the lower insets are 2.5 μm.
Figure 2
Figure 2
Mitochondrial Fragmentation Is Upstream of Effector Caspase Activation (A and B) (iii and vi) Phase-contrast and fluorescence images of (Aiv and Av) etoposide-, (Biv and Bv) C6-ceramide-, or (A and B) (i and ii) mock-treated hemocytes incubated with (i and iv) caspACE-FMK substrate or (ii and v) AnV (green), and PI (red) at the indicated times. Arrows indicate blebs. (C) Mitochondria (Mitotracker Red; green) and nuclei ([ii–iii] Hoechst-33342, [I] nuclear GFP; red, dotted outline) in (i) mock-, (ii) etoposide-, or (iii) C6-ceramide-treated DIAP-1+ (Col-GAL4,UAS-GFP; UAS-DIAP-1/+) hemocytes at indicated times. The nuclear CSA is indicated. Insets show a magnified view of the regions marked with an asterisk. (D and E) (i) Control and (ii and iii) DIAP-1+ hemocytes incubated with (ii) etoposide or (i and iii) C6-ceramide stained for (D) active effector caspases or (E) AnV (green) and PI (red) positivity at indicated times. (F–H) (F and H) Histogram showing the fraction of (F) etoposide- or (H) C6-ceramide-treated DIAP-1+ hemocytes (n = 100) with fragmented mitochondria (gray) or apoptotic nuclei (black) at the indicated times (mean ± SD; n = 3). (G) Histogram showing the fraction of etoposide-treated mock or DIAP-1+ and 50 μM zVAD-fmk-treated hemocytes (n = 100) with apoptotic nuclei (mean ± SD; n = 3). ∗∗p < 0.005. The scale bars in the panels are 5 μm; those in the insets are 2.5 μm.
Figure 3
Figure 3
Mitochondrial Morphology Is Extensively Tubular in drp-1 Mutants (A) Drosophila Drp-1 has an N-terminal GTPase domain, the middle domain, and a C-terminal GTPase effector domain. The mutations map to the GTPase domain. (B) Single-plane reconstruction of confocal images of mitochondria (Mitotracker Green) in (i) wild-type, (ii) drp-12, (iii) 3665/13510, and (iv) 13510/+ larval hemocytes. (C) Wide-field images of (i) 13510/+ and (ii) Dp/+; 13510/+ mitochondria. (D) Mitochondria (Mito-YFP) in (i) mock- or (ii) drp-1 dsRNA-treated cells. Arrows, arrowheads, and open arrowheads indicate tubular, fragmented, and extensively tubular mitochondria, respectively. Insets show magnified views of areas marked with an asterisk. (E) RT-PCR showed reduced levels of drp-1 RNA, not Rp49 RNA, in drp-1 dsRNA-treated cells. (F) FRAP of Mito-YFP measured in a defined mitochondrial region in mock- (black) or drp-1 (gray) dsRNA-treated S2R+ cells showed increased recovery in drp-1 dsRNA-treated cells (n = 35). The scale bars in the panels are 5 μm; those in the insets are 2.5 μm.
Figure 4
Figure 4
PCD Is Suppressed in drp-1 Mutants (A) Histogram showing the fraction of etoposide-treated wild-type (black) and drp-12 (gray) hemocytes (n = 100) with apoptotic nuclei (CSA < 10 μm2) at indicated times (mean ± SD; n = 3). (B and C) Histogram showing the fraction of (B) etoposide- or (C) cycloheximide-treated (0.5 μg/ml) wild-type, 3665/13510, or 13510/+ hemocytes (n = 100) with apoptotic nuclei ([B], mean ± propagated error; [C], mean ± SD; n = 3). (D) Histogram showing the number of surviving YFP-positive cells incubated for 5 days with either mock (black) or drp-1 (gray) dsRNA and treated with cycloheximide and actinomycin-D (18 hr), normalized to the number of untreated cells. (E) Histogram showing the fraction of C6-ceramide-treated (10 hr) drp-12 hemocytes (n = 100) with apoptotic nuclei, normalized to apoptotic wild-type cells (mean ± SD; n = 3). (F) (i, ii, v, and vi) Etoposide- or (iii, iv, vii, and viii) C6-ceramide-treated (i, iii, v, and vii) drp-12 and (ii, iv, vi, and viii) 3665/13510 hemocytes stained for (i–iv) active effector caspases or (v–viii) AnV (green) and PI (red) accessibility. (G) Mitochondria (Mitotracker Green; green) and nuclei (Hoechst-33342; red, dotted outline) in etoposide-treated (i) wild-type, (ii) drp-12, and (iii) 3665/13510 hemocytes showed a mitochondrial fragmentation defect and a block in nuclear condensation, as indicated by the nuclear CSA. (H) Mitochondria (anti-Biotin) in C6-ceramide-treated (i) drp-12 and (ii and iii) 3665/13510 hemocytes at indicated times. The insets show magnified views of the regions marked with an asterisk. Arrows and arrowheads indicate tubular and fragmented mitochondria, respectively. (I) Optic lobes (OL) and ventral ganglion (VG) of the (i) wild-type or (ii) drp-12 third-instar larval CNS. p < 0.05; ∗∗p < 0.005. The scale bar is 100 μm in (I), 5 μm in all other panels, and 2.5 μm in all insets. (J) In Drosophila, multiple apoptotic stimuli such as ecdysone, genotoxic stresses, or C6-ceramide result in fragmentation (blue box) of elongated (red outline) mitochondria (green). Unlike with genotoxic stress, there is an increase in mitochondrial contiguity (purple outline) prior to its fragmentation during lipid-mediated cell death. Mitochondrial fragmentation mediated by Drp-1 (light-blue dots) upstream of effector caspase activation, PS exposure, nuclear condensation, and plasma membrane permeability affects cell death. Thus, mitochondrial remodeling modifies the susceptibility of cells to PCD.

Similar articles

Cited by

References

    1. Adams J.M., Cory S. Apoptosomes: engines for caspase activation. Curr. Opin. Cell Biol. 2002;14:715–720. - PubMed
    1. Arama E., Agapite J., Steller H. Caspase activity and a specific cytochrome C are required for sperm differentiation in Drosophila. Dev. Cell. 2003;4:687–697. - PubMed
    1. Brand A.H., Perrimon N. Targeted gene expression as a means of altering cell fates and generating dominant phenotypes. Development. 1993;118:401–415. - PubMed
    1. Breckenridge D.G., Stojanovic M., Marcellus R.C., Shore G.C. Caspase cleavage product of BAP31 induces mitochondrial fission through endoplasmic reticulum calcium signals, enhancing cytochrome c release to the cytosol. J. Cell Biol. 2003;160:1115–1127. - PMC - PubMed
    1. Chew S.K., Akdemir F., Chen P., Lu W.J., Mills K., Daish T., Kumar S., Rodriguez A., Abrams J.M. The apical caspase dronc governs programmed and unprogrammed cell death in Drosophila. Dev. Cell. 2004;7:897–907. - PubMed

Publication types

LinkOut - more resources