CD8 single-cell gene coexpression reveals three different effector types present at distinct phases of the immune response
- PMID: 17485515
- PMCID: PMC2118592
- DOI: 10.1084/jem.20062349
CD8 single-cell gene coexpression reveals three different effector types present at distinct phases of the immune response
Abstract
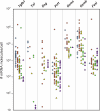
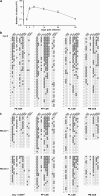
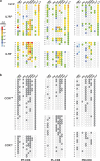
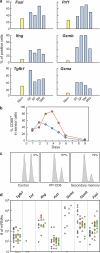
To study in vivo CD8 T cell differentiation, we quantified the coexpression of multiple genes in single cells throughout immune responses. After in vitro activation, CD8 T cells rapidly express effector molecules and cease their expression when the antigen is removed. Gene behavior after in vivo activation, in contrast, was quite heterogeneous. Different mRNAs were induced at very different time points of the response, were transcribed during different time periods, and could decline or persist independently of the antigen load. Consequently, distinct gene coexpression patterns/different cell types were generated at the various phases of the immune responses. During primary stimulation, inflammatory molecules were induced and down-regulated shortly after activation, generating early cells that only mediated inflammation. Cytotoxic T cells were generated at the peak of the primary response, when individual cells simultaneously expressed multiple killer molecules, whereas memory cells lost killer capacity because they no longer coexpressed killer genes. Surprisingly, during secondary responses gene transcription became permanent. Secondary cells recovered after antigen elimination were more efficient killers than cytotoxic T cells present at the peak of the primary response. Thus, primary responses produced two transient effector types. However, after boosting, CD8 T cells differentiate into long-lived killer cells that persist in vivo in the absence of antigen.
Figures


Similar articles
-
Prolonged interleukin-2Ralpha expression on virus-specific CD8+ T cells favors terminal-effector differentiation in vivo.Immunity. 2010 Jan 29;32(1):91-103. doi: 10.1016/j.immuni.2009.11.010. Epub 2010 Jan 21. Immunity. 2010. PMID: 20096608
-
Transcriptional regulator Id2 mediates CD8+ T cell immunity.Nat Immunol. 2006 Dec;7(12):1317-25. doi: 10.1038/ni1403. Epub 2006 Nov 5. Nat Immunol. 2006. PMID: 17086188
-
Molecular profiling reveals distinct functional attributes of CD1d-restricted natural killer (NK) T cell subsets.Mol Immunol. 2008 May;45(9):2607-20. doi: 10.1016/j.molimm.2007.12.022. Epub 2008 Mar 4. Mol Immunol. 2008. PMID: 18304639
-
Stem cell-like plasticity of naïve and distinct memory CD8+ T cell subsets.Semin Immunol. 2009 Apr;21(2):62-8. doi: 10.1016/j.smim.2009.02.004. Epub 2009 Mar 9. Semin Immunol. 2009. PMID: 19269852 Review.
-
Cell biology of T cell activation and differentiation.Int Rev Cytol. 2006;250:217-74. doi: 10.1016/S0074-7696(06)50006-3. Int Rev Cytol. 2006. PMID: 16861067 Review.
Cited by
-
Asymptomatic memory CD8+ T cells: from development and regulation to consideration for human vaccines and immunotherapeutics.Hum Vaccin Immunother. 2014;10(4):945-63. doi: 10.4161/hv.27762. Epub 2014 Feb 5. Hum Vaccin Immunother. 2014. PMID: 24499824 Free PMC article. Review.
-
The growth threshold conjecture: a theoretical framework for understanding T-cell tolerance.R Soc Open Sci. 2015 Jul 8;2(7):150016. doi: 10.1098/rsos.150016. eCollection 2015 Jul. R Soc Open Sci. 2015. PMID: 26587263 Free PMC article.
-
Vaccine adjuvants aluminum and monophosphoryl lipid A provide distinct signals to generate protective cytotoxic memory CD8 T cells.Proc Natl Acad Sci U S A. 2011 May 10;108(19):7914-9. doi: 10.1073/pnas.1104588108. Epub 2011 Apr 25. Proc Natl Acad Sci U S A. 2011. PMID: 21518876 Free PMC article.
-
Single insulin-specific CD8+ T cells show characteristic gene expression profiles in human type 1 diabetes.Diabetes. 2011 Dec;60(12):3289-99. doi: 10.2337/db11-0270. Epub 2011 Oct 13. Diabetes. 2011. PMID: 21998398 Free PMC article.
-
Genome-wide and single-cell analyses reveal a context dependent relationship between CBP recruitment and gene expression.Nucleic Acids Res. 2014 Oct;42(18):11363-82. doi: 10.1093/nar/gku827. Epub 2014 Sep 23. Nucleic Acids Res. 2014. PMID: 25249627 Free PMC article.
References
-
- Lee, G.R., S.T. Kim, C.G. Spilianakis, P.E. Fields, and R.A. Flavell. 2006. T helper cell differentiation: regulation by cis elements and epigenetics. Immunity. 24:369–379. - PubMed
-
- Surh, C.D., O. Boyman, J.F. Purton, and J. Sprent. 2006. Homeostasis of memory T cells. Immunol. Rev. 211:154–163. - PubMed
-
- Veiga-Fernandes, H., U. Walter, C. Bourgeois, A. McLean, and B. Rocha. 2000. Response of naive and memory CD8+ T cells to antigen stimulation in vivo. Nat. Immunol. 1:47–53. - PubMed
Publication types
MeSH terms
Substances
LinkOut - more resources
Full Text Sources
Other Literature Sources
Research Materials

