. 2007 May 7;177(3):425-37.
doi: 10.1083/jcb.200611166.

Emi1 is needed to couple DNA replication with mitosis but does not regulate activation of the mitotic APC/C

Affiliations

Emi1 is needed to couple DNA replication with mitosis but does not regulate activation of the mitotic APC/C

Barbara Di Fiore et al. J Cell Biol. .

Abstract

Ubiquitin-mediated proteolysis is critical for the alternation between DNA replication and mitosis and for the key regulatory events in mitosis. The anaphase-promoting complex/cyclosome (APC/C) is a conserved ubiquitin ligase that has a fundamental role in regulating mitosis and the cell cycle in all eukaryotes. In vertebrate cells, early mitotic inhibitor 1 (Emi1) has been proposed as an important APC/C inhibitor whose destruction may trigger activation of the APC/C at mitosis. However, in this study, we show that the degradation of Emi1 is not required to activate the APC/C in mitosis. Instead, we uncover a key role for Emi1 in inhibiting the APC/C in interphase to stabilize the mitotic cyclins and geminin to promote mitosis and prevent rereplication. Thus, Emi1 plays a crucial role in the cell cycle to couple DNA replication with mitosis, and our results also question the current view that the APC/C has to be inactivated to allow DNA replication.


Figures
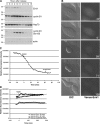
Figure 1.
Figure 1.
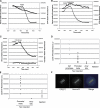
Emi1 is degraded in prophase. (A) Emi1 levels were analyzed by Western blotting in extracts from HeLa cells synchronized at the G1/S transition by thymidine/aphidicolin block and then released and followed through S and G2 phases and mitosis. Cyclin B1 levels were also analyzed. Anti–cyclin B1 S133 phosphospecific antibody was used as a read-out of Plk1 activity. Hsp70 and actin were used as loading controls. Molecular mass markers (given in kilodaltons) are shown. (B) HeLa cells injected with Emi1 were followed by video microscopy through G2 phase and mitosis. The DIC images were used to determine the different phases and mitotic stages. Time (given in minutes) is shown taking NEBD as t = 0. In general, cells expressing ectopic Emi1 took slightly longer to complete mitosis than control cells. (C) Quantification of fluorescence levels of the cell shown in B. Time of NEBD and anaphase are indicated. Representative of 39 cells from 11 experiments. (D) Two different mutants in the β-TrCP recognition site (D144A and G146V) and the S145A/S149A phosphorylation site mutant are stable after injection in HeLa cells. Representative of 43 cells from 10 experiments for D144A mutant, 44 cells from eight experiments for G146V mutant, and 30 cells from five experiments for the S145A/S149A mutant.
Figure 2.
Figure 2.
The timing of degradation of cyclins A and B1 and securin is not affected by the presence of Emi1. (A) Cyclin A–CFP: HeLa cells were coinjected in G2 phase with Venus-Emi1 D144A and cyclin A–CFP and followed by time-lapse microscopy. The fluorescence levels of both proteins were measured and plotted over time. NEBD was determined from the DIC images. This result is representative of four cells from two experiments with Venus-Emi1 D144A, 14 cells from three experiments with Venus-Emi1 G146V, and eight cells from five experiments with Venus-Emi1 S145A/S149A. The apparent decrease of Venus-Emi1 D144A fluorescence is the result of photobleaching. (B) Cyclin B1–CFP: HeLa cells were coinjected in G2 phase with Venus-Emi1 D144A and cyclin B1–CFP and analyzed as in A. This result is representative of 15 cells in six experiments with Venus-Emi1 D144A and six cells in three experiments with Venus-Emi1 G146V. (C) Securin- Cerulean: HeLa cells were coinjected in G2 phase with Venus-Emi1 D144A and securin-Cerulean followed by time-lapse fluorescence microscopy, and the fluorescence levels were measured and analyzed as in A and B. This result is representative of seven cells in three experiments with Venus-Emi1 D144A. Note that in these experiments, lower amounts of Venus-Emi1 D144A were injected. (D) Cyclin A: HeLa cells injected with Venus-Emi1 D144A in G2 phase were followed by time-lapse microscopy and fixed after they had delayed in metaphase. Cells were stained for cyclin A, and the levels were quantified in the injected arrested cells and in control noninjected cells at different stages. The quantification shown is of PFA-fixed cells, and similar results were obtained after methanol/acetone fixation. Similar results were obtained with two different cyclin A antibodies. Results are representative of four experiments. (E) Cyclin B1 levels analyzed on cells injected, filmed, and stained as in D. The quantification shown is of cells fixed in methanol/acetone, and similar results were obtained after PFA fixation. Results are representative of five experiments. (F) HeLa cells that delay in mitosis after Venus-Emi1 D144A injection (blue in the merge) were fixed and stained with CREST serum (red in the merge) and aurora B antibodies (green in the merge). Representative of 11 cells analyzed. Bar, 15 μm.
Figure 3.
Figure 3.
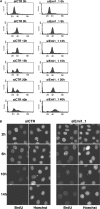
Emi1 is required for mitotic entry. (A) Thymidine/aphidicolin-synchronized cells were transfected during the release from thymidine with either control (left) or Emi1_1 (right) siRNA oligonucleotides. Cells were analyzed at various times after aphidicolin release by propidium iodide staining and flow cytometry. The time indicates hours after aphidicolin release. Representative of two experiments. (B) Cells were transfected as in A, labeled with BrdU for 30 min before fixation, and stained with anti-BrdU antibodies at the indicated times after release from an aphidicolin block. Total DNA was stained with Hoechst 33342. Bar, 10 μm.
Figure 4.
Figure 4.
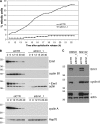
Emi1 is required to accumulate cyclins A and B1. (A) Cumulative number of cells entering mitosis (NEBD) plotted over time, as observed by time-lapse DIC microscopy of cells transfected with either control or Emi1_1 siRNA. Representative of three experiments. (B) Emi1 and cyclins A and B1 levels in cells transfected with either control or siEmi1_1 siRNA were analyzed by Western blotting. These samples correspond to the time points after release from a G1/S block as shown in Fig. 3 A. Actin and Hsp70 are shown as loading controls. The asterisk marks residual Emi1 signal. The same extracts were run on two different gels (top and bottom), and a loading control is shown for each gel. Results are representative of two experiments. (C) HeLa cells were transfected with either control (siCTR) or Emi1 (siEmi1_1) siRNA oligonucleotides, and, 24 h after transfection, MG132 was added for 6 h. Actin is shown as a loading control. The asterisk denotes residual cyclin A signal.
Figure 5.
Figure 5.
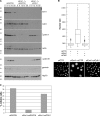
Emi1 is required to prevent rereplication. (A) Asynchronous HeLa cells were transfected with control or two different Emi1 siRNAs, and Emi1 levels were analyzed by Western blotting 24, 48, and 72 h after transfection. Actin is shown as a loading control. Results are representative of four experiments. (B) DNA content of cells transfected as in A and analyzed by flow cytometry after staining with propidium iodide. Results are representative of four experiments. (C) Cells transfected as in A were stained with Hoechst to visualize the nuclei. Bars, 30 μm. (D) Cells cotransfected with control and Emi1 siRNAs plus expression vectors encoding Venus (control) or Venus-Emi1 (as indicated) were fixed 48 and 72 h after transfection, and DNA was stained with Hoechst. The nuclear size (in pixels on the y axis) was measured using ImageJ software. The small bars in the dot plot show the minimum and maximum values, and the box shows the first and third quartiles. The bar in the box is the median value. Outliers (closed circles) and suspected outliers (open circles) as determined by statistical analysis are shown. Results are representative of two independent experiments. More than 100 nuclei were measured for each sample.
Figure 6.
Figure 6.
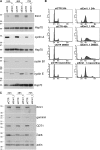
Cyclins A and B1 and geminin levels are reduced, whereas cyclin E increases in rereplicating cells induced by Emi1 knockdown. (A) Asynchronous HeLa cells were transfected with control (siCTR) or Emi1 (siEmi1_1) siRNA duplexes, and samples were collected 24, 48, or 72 h after transfection. Hsp70 is shown as a loading control. The asterisk denotes residual cyclin B1 signal. The same extracts were run on three different gels, and a loading control is shown for each gel. Results are representative of three independent experiments. (B) Asynchronous HeLa cells were transfected with either control (siCTR) or Emi1 (siEmi1_1) siRNA oligonucleotides, and cell ploidy was analyzed by flow cytometry. DMSO or roscovitine was added or not added 24 h after transfection, and cells were analyzed 24 h later. Results are representative of two independent experiments. (C) Cells were transfected as in A to analyze geminin, CDT1, and cdc6 levels. Actin is shown as a loading control. The asterisk denotes residual CDT1 signal. Results are representative of two independent experiments.
Figure 7.
Figure 7.
Rereplication induced by Emi1 down-regulation depends on Cdh1 activity. (A) Thymidine/aphidicolin-synchronized HeLa cells were transfected during release from the thymidine block with the indicated combinations of siRNA oligonucleotides directed against glyceraldehyde-3-phosphate dehydrogenase (negative control), Emi1, and Cdh1. Protein levels were analyzed at the indicated times after aphidicolin release. Actin is shown as a loading control. The asterisk denotes residual Cdh1 signal. (B) Asynchronous HeLa cells were transfected with siRNA oligonucleotides as indicated. 72 h after transfection, cells were fixed, and DNA was stained with Hoechst 33342. The nuclear size was measured and plotted as in Fig. 5 D. 200–300 nuclei were quantified for each sample. The small bars in the dot plot show the minimum and maximum values, and the box shows the first and third quartiles. The bar in the box is the median value. Outliers (closed circles) and suspected outliers (open circles) as determined by statistical analysis are shown. (C) Cells were synchronized and transfected as in A, taxol was added 10 h after release from aphidicolin, and mitotic figures were scored 10 h later as a measure of mitotic entry. About 1,500 cells were analyzed for each sample. (A–C) Representative of two experiments. Bars, 30 μm.

Similar articles

Cited by

References

    1. Amon, A., S. Irniger, and K. Nasmyth. 1994. Closing the cell cycle circle in yeast: G2 cyclin proteolysis initiated at mitosis persists until the activation of G1 cyclins in the next cycle. Cell. 77:1037–1050. - PubMed
    1. Brandeis, M., and T. Hunt. 1996. The proteolysis of mitotic cyclins in mammalian cells persists from the end of mitosis until the onset of S phase. EMBO J. 15:5280–5289. - PMC - PubMed
    1. Broek, D., R. Bartlett, K. Crawford, and P. Nurse. 1991. Involvement of p34cdc2 in establishing the dependency of S phase on mitosis. Nature. 349:388–393. - PubMed
    1. Brummelkamp, T.R., R. Bernards, and R. Agami. 2002. A system for stable expression of short interfering RNAs in mammalian cells. Science. 296:550–553. - PubMed
    1. Castro, A., C. Bernis, S. Vigneron, J.C. Labbe, and T. Lorca. 2005. The anaphase-promoting complex: a key factor in the regulation of cell cycle. Oncogene. 24:314–325. - PubMed

Publication types