Coordinated regulation of nutrient and inflammatory responses by STAMP2 is essential for metabolic homeostasis
- PMID: 17482547
- PMCID: PMC2408881
- DOI: 10.1016/j.cell.2007.02.049
Coordinated regulation of nutrient and inflammatory responses by STAMP2 is essential for metabolic homeostasis
Abstract
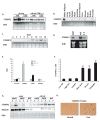
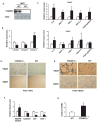
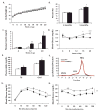
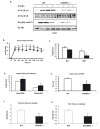
Metabolic and inflammatory pathways crosstalk at many levels, and, while required for homeostasis, interaction between these pathways can also lead to metabolic dysregulation under conditions of chronic stress. Thus, we hypothesized that mechanisms might exist to prevent overt inflammatory responses during physiological fluctuations in nutrients or under nutrient-rich conditions, and we identified the six-transmembrane protein STAMP2 as a critical modulator of this integrated response system of inflammation and metabolism in adipocytes. Lack of STAMP2 in adipocytes results in aberrant inflammatory responses to both nutrients and acute inflammatory stimuli. Similarly, in whole animals, visceral adipose tissue of STAMP2(-/-) mice exhibits overt inflammation, and these mice develop spontaneous metabolic disease on a regular diet, manifesting insulin resistance, glucose intolerance, mild hyperglycemia, dyslipidemia, and fatty liver disease. We conclude that STAMP2 participates in integrating inflammatory and metabolic responses and thus plays a key role in systemic metabolic homeostasis.
Figures


Comment in
-
STAMPing out Inflammation.Cell. 2007 May 4;129(3):451-2. doi: 10.1016/j.cell.2007.04.022. Cell. 2007. PMID: 17482536
Similar articles
-
Expression of six transmembrane protein of prostate 2 in human adipose tissue associates with adiposity and insulin resistance.J Clin Endocrinol Metab. 2008 Jun;93(6):2249-54. doi: 10.1210/jc.2008-0206. Epub 2008 Apr 1. J Clin Endocrinol Metab. 2008. PMID: 18381574
-
Inflammation and ER stress differentially regulate STAMP2 expression and localization in adipocytes.Metabolism. 2019 Apr;93:75-85. doi: 10.1016/j.metabol.2019.01.014. Epub 2019 Jan 30. Metabolism. 2019. PMID: 30710574 Free PMC article.
-
Hepatic STAMP2 alleviates high fat diet-induced hepatic steatosis and insulin resistance.J Hepatol. 2015 Aug;63(2):477-85. doi: 10.1016/j.jhep.2015.01.025. Epub 2015 Jan 31. J Hepatol. 2015. PMID: 25646886
-
Has natural selection in human populations produced two types of metabolic syndrome (with and without fatty liver)?J Gastroenterol Hepatol. 2007 Jun;22 Suppl 1:S11-9. doi: 10.1111/j.1440-1746.2006.04639.x. J Gastroenterol Hepatol. 2007. PMID: 17567458 Review.
-
Interleukins in adipose tissue: Keeping the balance.Mol Cell Endocrinol. 2022 Feb 15;542:111531. doi: 10.1016/j.mce.2021.111531. Epub 2021 Dec 12. Mol Cell Endocrinol. 2022. PMID: 34910978 Review.
Cited by
-
An inhibitor of the protein kinases TBK1 and IKK-ɛ improves obesity-related metabolic dysfunctions in mice.Nat Med. 2013 Mar;19(3):313-21. doi: 10.1038/nm.3082. Epub 2013 Feb 10. Nat Med. 2013. PMID: 23396211 Free PMC article.
-
Expression of miR-199a-3p in human adipocytes is regulated by free fatty acids and adipokines.Mol Med Rep. 2016 Aug;14(2):1180-6. doi: 10.3892/mmr.2016.5379. Epub 2016 Jun 8. Mol Med Rep. 2016. PMID: 27279151 Free PMC article.
-
Stamp2 controls macrophage inflammation through nicotinamide adenine dinucleotide phosphate homeostasis and protects against atherosclerosis.Cell Metab. 2012 Jul 3;16(1):81-9. doi: 10.1016/j.cmet.2012.05.009. Epub 2012 Jun 14. Cell Metab. 2012. PMID: 22704678 Free PMC article.
-
The Role of Adipocyte Endoplasmic Reticulum Stress in Obese Adipose Tissue Dysfunction: A Review.Int J Gen Med. 2023 Sep 27;16:4405-4418. doi: 10.2147/IJGM.S428482. eCollection 2023. Int J Gen Med. 2023. PMID: 37789878 Free PMC article. Review.
-
The metabolic syndrome.Endocr Rev. 2008 Dec;29(7):777-822. doi: 10.1210/er.2008-0024. Epub 2008 Oct 29. Endocr Rev. 2008. PMID: 18971485 Free PMC article. Review.
References
-
- Amzallag N, Passer BJ, Allanic D, Segura E, Thery C, Goud B, Amson R, Telerman A. TSAP6 facilitates the secretion of translationally controlled tumor protein/histamine-releasing factor via a nonclassical pathway. J Biol Chem. 2004;279(44):46104–12. - PubMed
-
- Arkan MC, Hevener AL, Greten FR, Maeda S, Li ZW, Long JM, Wynshaw-Boris A, Poli G, Olefsky J, Karin M. IKK-beta links inflammation to obesity-induced insulin resistance. Nat Med. 2005;11(2):191–8. - PubMed
-
- Bligh EG, Dyer WJ. A rapid method of total lipid extraction and purification. Can J Biochem Physiol. 1959;37(8):911–7. - PubMed
-
- Brownlee M. Biochemistry and molecular cell biology of diabetic complications. Nature. 2001;414(6865):813–20. - PubMed
Publication types
MeSH terms
Substances
Grants and funding
- R01 DK052539-02/DK/NIDDK NIH HHS/United States
- P30 DK040561/DK/NIDDK NIH HHS/United States
- R01 DK052539-08/DK/NIDDK NIH HHS/United States
- P30 DK040561-12/DK/NIDDK NIH HHS/United States
- T90 DK070078/DK/NIDDK NIH HHS/United States
- R01 DK052539-07/DK/NIDDK NIH HHS/United States
- R01 DK052539-10/DK/NIDDK NIH HHS/United States
- R01 DK052539-03/DK/NIDDK NIH HHS/United States
- R01 DK052539-06/DK/NIDDK NIH HHS/United States
- R01 DK052539/DK/NIDDK NIH HHS/United States
- R01 DK052539-04/DK/NIDDK NIH HHS/United States
- R01 DK052539-09/DK/NIDDK NIH HHS/United States
- R01 DK052539-06S1/DK/NIDDK NIH HHS/United States
- DK52539/DK/NIDDK NIH HHS/United States
- R01 DK052539-05/DK/NIDDK NIH HHS/United States
LinkOut - more resources
Full Text Sources
Other Literature Sources
Molecular Biology Databases

