Comparison of immunoglobulin G responses to the spike and nucleocapsid proteins of severe acute respiratory syndrome (SARS) coronavirus in patients with SARS
- PMID: 17475765
- PMCID: PMC1951070
- DOI: 10.1128/CVI.00432-06
Comparison of immunoglobulin G responses to the spike and nucleocapsid proteins of severe acute respiratory syndrome (SARS) coronavirus in patients with SARS
Abstract
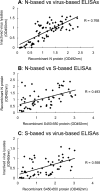
Both the nucleocapsid (N) and the spike (S) proteins of severe acute respiratory syndrome (SARS)-associated coronavirus (SARS-CoV) are able to induce strong humoral responses in humans following an infection. To compare the immunoglobulin G (IgG) responses to the S and N proteins of SARS-CoV in SARS patients during the manifestation/convalescent period with those during the postinfection period, serum samples were collected from hospitalized SARS patients within 6 weeks after the onset of illness (set 1; 57 sequential samples from 19 patients) or 2 to 3 months after their recovery (set 2; 33 postinfection samples from 33 subjects). Serum samples from 100 healthy blood donors (set 3), collected in 2002, were also included. The specific IgG response to whole virus, the fragment from positions 450 to 650 of the S protein (S450-650), and the full-length N protein of SARS-CoV were measured by enzyme-linked immunosorbent assays (ELISAs). Western blot assays were carried out to confirm the ELISA results. Fifty-one of the serum samples in set 1 (89%) bound to the N protein, a proportion similar to that which recognized whole virus (79%) and the S-protein fragment (77%). All 33 serum samples from set 2 were strongly positive for N-protein-specific IgG, while 27 (82%) were positive for anti-S450-650 IgG. Two of the serum samples from set 3 were strongly positive for anti-N-protein IgG but not anti-S450-650 IgG. Similar levels of IgG responses to the S and N proteins were observed in SARS patients during the manifestation and convalescent stages. In the postinfection period, however, a number of patients had much lower serum IgG levels against S450-650 than against the N protein.
Figures


Similar articles
-
Longitudinal profile of immunoglobulin G (IgG), IgM, and IgA antibodies against the severe acute respiratory syndrome (SARS) coronavirus nucleocapsid protein in patients with pneumonia due to the SARS coronavirus.Clin Diagn Lab Immunol. 2004 Jul;11(4):665-8. doi: 10.1128/CDLI.11.4.665-668.2004. Clin Diagn Lab Immunol. 2004. PMID: 15242938 Free PMC article.
-
Differential sensitivities of severe acute respiratory syndrome (SARS) coronavirus spike polypeptide enzyme-linked immunosorbent assay (ELISA) and SARS coronavirus nucleocapsid protein ELISA for serodiagnosis of SARS coronavirus pneumonia.J Clin Microbiol. 2005 Jul;43(7):3054-8. doi: 10.1128/JCM.43.7.3054-3058.2005. J Clin Microbiol. 2005. PMID: 16000415 Free PMC article.
-
Profiles of IgG antibodies to nucleocapsid and spike proteins of the SARS-associated coronavirus in SARS patients.DNA Cell Biol. 2005 Aug;24(8):521-7. doi: 10.1089/dna.2005.24.521. DNA Cell Biol. 2005. PMID: 16101351
-
Immunological responses against SARS-coronavirus infection in humans.Cell Mol Immunol. 2004 Apr;1(2):119-22. Cell Mol Immunol. 2004. PMID: 16212898 Review.
-
The effectiveness of convalescent plasma and hyperimmune immunoglobulin for the treatment of severe acute respiratory infections of viral etiology: a systematic review and exploratory meta-analysis.J Infect Dis. 2015 Jan 1;211(1):80-90. doi: 10.1093/infdis/jiu396. Epub 2014 Jul 16. J Infect Dis. 2015. PMID: 25030060 Free PMC article. Review.
Cited by
-
A Minimalist Strategy Towards Temporarily Defining Protection for COVID-19.SN Compr Clin Med. 2020;2(11):2059-2066. doi: 10.1007/s42399-020-00533-4. Epub 2020 Sep 19. SN Compr Clin Med. 2020. PMID: 32984765 Free PMC article. Review.
-
A systematic review of antibody mediated immunity to coronaviruses: kinetics, correlates of protection, and association with severity.Nat Commun. 2020 Sep 17;11(1):4704. doi: 10.1038/s41467-020-18450-4. Nat Commun. 2020. PMID: 32943637 Free PMC article.
-
A Universal Fluorescent Immunochromatography Assay Based on Quantum Dot Nanoparticles for the Rapid Detection of Specific Antibodies against SARS-CoV-2 Nucleocapsid Protein.Int J Mol Sci. 2022 Jun 2;23(11):6225. doi: 10.3390/ijms23116225. Int J Mol Sci. 2022. PMID: 35682904 Free PMC article.
-
ReScan, a Multiplex Diagnostic Pipeline, Pans Human Sera for SARS-CoV-2 Antigens.Cell Rep Med. 2020 Oct 20;1(7):100123. doi: 10.1016/j.xcrm.2020.100123. Epub 2020 Sep 24. Cell Rep Med. 2020. PMID: 32995758 Free PMC article.
-
Differentiation between human coronaviruses NL63 and 229E using a novel double-antibody sandwich enzyme-linked immunosorbent assay based on specific monoclonal antibodies.Clin Vaccine Immunol. 2011 Jan;18(1):113-8. doi: 10.1128/CVI.00355-10. Epub 2010 Nov 17. Clin Vaccine Immunol. 2011. PMID: 21084464 Free PMC article.
References
-
- Garbino, J., S. Crespo, J. D. Aubert, T. Rochat, B. Ninet, C. Deffernez, W. Wunderli, J. C. Pache, P. M. Soccal, and L. Kaiser. 2006. A prospective hospital-based study of the clinical impact of non-severe acute respiratory syndrome (non-SARS)-related human coronavirus infection. Clin. Infect. Dis. 431009-1015. - PMC - PubMed
-
- Krokhin, O., Y. Li, A. Andonov, H. Feldmann, R. Flick, S. Jones, U. Stroeher, N. Bastien, K. V. Dasuri, K. Cheng, J. N. Simonsen, H. Perreault, J. Wilkins, W. Ens, F. Plummer, and K. G. Standing. 2003. Mass spectrometric characterization of proteins from the SARS virus: a preliminary report. Mol. Cell. Proteomics 2346-356. - PMC - PubMed
-
- Ksiazek, T. G., D. Erdman, C. S. Goldsmith, S. R. Zaki, T. Peret, S. Emery, S. Tong, C. Urbani, J. A. Comer, W. Lim, P. E. Rollin, S. F. Dowell, A. E. Ling, C. D. Humphrey, W. J. Shieh, J. Guarner, C. D. Paddock, P. Rota, B. Fields, J. DeRisi, J. Y. Yang, N. Cox, J. M. Hughes, J. W. LeDuc, W. J. Bellini, and L. J. Anderson. 2003. A novel coronavirus associated with severe acute respiratory syndrome. N. Engl. J. Med. 3481953-1966. - PubMed
Publication types
MeSH terms
Substances
LinkOut - more resources
Full Text Sources
Miscellaneous

