Muscle mitochondrial ATP synthesis and glucose transport/phosphorylation in type 2 diabetes
- PMID: 17472434
- PMCID: PMC1858707
- DOI: 10.1371/journal.pmed.0040154
Muscle mitochondrial ATP synthesis and glucose transport/phosphorylation in type 2 diabetes
Abstract
Background: Muscular insulin resistance is frequently characterized by blunted increases in glucose-6-phosphate (G-6-P) reflecting impaired glucose transport/phosphorylation. These abnormalities likely relate to excessive intramyocellular lipids and mitochondrial dysfunction. We hypothesized that alterations in insulin action and mitochondrial function should be present even in nonobese patients with well-controlled type 2 diabetes mellitus (T2DM).
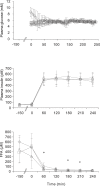
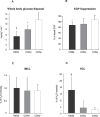
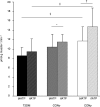
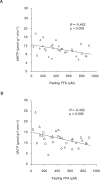
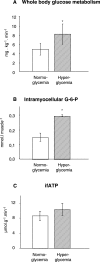
Methods and findings: We measured G-6-P, ATP synthetic flux (i.e., synthesis) and lipid contents of skeletal muscle with (31)P/(1)H magnetic resonance spectroscopy in ten patients with T2DM and in two control groups: ten sex-, age-, and body mass-matched elderly people; and 11 younger healthy individuals. Although insulin sensitivity was lower in patients with T2DM, muscle lipid contents were comparable and hyperinsulinemia increased G-6-P by 50% (95% confidence interval [CI] 39%-99%) in all groups. Patients with diabetes had 27% lower fasting ATP synthetic flux compared to younger controls (p = 0.031). Insulin stimulation increased ATP synthetic flux only in controls (younger: 26%, 95% CI 13%-42%; older: 11%, 95% CI 2%-25%), but failed to increase even during hyperglycemic hyperinsulinemia in patients with T2DM. Fasting free fatty acids and waist-to-hip ratios explained 44% of basal ATP synthetic flux. Insulin sensitivity explained 30% of insulin-stimulated ATP synthetic flux.
Conclusions: Patients with well-controlled T2DM feature slightly lower flux through muscle ATP synthesis, which occurs independently of glucose transport /phosphorylation and lipid deposition but is determined by lipid availability and insulin sensitivity. Furthermore, the reduction in insulin-stimulated glucose disposal despite normal glucose transport/phosphorylation suggests further abnormalities mainly in glycogen synthesis in these patients.
Conflict of interest statement
Figures
Similar articles
-
Decreased insulin-stimulated ATP synthesis and phosphate transport in muscle of insulin-resistant offspring of type 2 diabetic parents.PLoS Med. 2005 Sep;2(9):e233. doi: 10.1371/journal.pmed.0020233. Epub 2005 Aug 16. PLoS Med. 2005. PMID: 16089501 Free PMC article. Clinical Trial.
-
Relationship between hepatic/visceral fat and hepatic insulin resistance in nondiabetic and type 2 diabetic subjects.Gastroenterology. 2007 Aug;133(2):496-506. doi: 10.1053/j.gastro.2007.04.068. Epub 2007 May 1. Gastroenterology. 2007. PMID: 17681171
-
Increased lipid availability impairs insulin-stimulated ATP synthesis in human skeletal muscle.Diabetes. 2006 Jan;55(1):136-40. Diabetes. 2006. PMID: 16380486 Clinical Trial.
-
Muscle triglycerides and mitochondrial function: possible mechanisms for the development of type 2 diabetes.Int J Obes (Lond). 2005 Sep;29 Suppl 2:S111-5. doi: 10.1038/sj.ijo.0803102. Int J Obes (Lond). 2005. PMID: 16385762 Review.
-
Muscular mitochondrial dysfunction and type 2 diabetes mellitus.Curr Opin Clin Nutr Metab Care. 2007 Nov;10(6):698-703. doi: 10.1097/MCO.0b013e3282f0eca9. Curr Opin Clin Nutr Metab Care. 2007. PMID: 18089950 Review.
Cited by
-
Akt2 influences glycogen synthase activity in human skeletal muscle through regulation of NH₂-terminal (sites 2 + 2a) phosphorylation.Am J Physiol Endocrinol Metab. 2013 Mar 15;304(6):E631-9. doi: 10.1152/ajpendo.00494.2012. Epub 2013 Jan 15. Am J Physiol Endocrinol Metab. 2013. PMID: 23321478 Free PMC article.
-
A simple approach to evaluate the kinetic rate constant for ATP synthesis in resting human skeletal muscle at 7 T.NMR Biomed. 2016 Sep;29(9):1240-8. doi: 10.1002/nbm.3310. Epub 2015 May 6. NMR Biomed. 2016. PMID: 25943328 Free PMC article.
-
Genetically increasing flux through β-oxidation in skeletal muscle increases mitochondrial reductive stress and glucose intolerance.Am J Physiol Endocrinol Metab. 2021 May 1;320(5):E938-E950. doi: 10.1152/ajpendo.00010.2021. Epub 2021 Apr 5. Am J Physiol Endocrinol Metab. 2021. PMID: 33813880 Free PMC article.
-
The integrative biology of type 2 diabetes.Nature. 2019 Dec;576(7785):51-60. doi: 10.1038/s41586-019-1797-8. Epub 2019 Dec 4. Nature. 2019. PMID: 31802013 Review.
-
Hyperglycemia-Induced Aberrant Cell Proliferation; A Metabolic Challenge Mediated by Protein O-GlcNAc Modification.Cells. 2019 Aug 28;8(9):999. doi: 10.3390/cells8090999. Cells. 2019. PMID: 31466420 Free PMC article. Review.
References
-
- Krssak M, Falk Petersen K, Dresner A, DiPietro L, Vogel SM, et al. Intramyocellular lipid concentrations are correlated with insulin sensitivity in humans: A 1H NMR spectroscopy study. Diabetologia. 1999;42:113–116. - PubMed
-
- Goodpaster BH, He J, Watkins S, Kelley DE. Skeletal muscle lipid content and insulin resistance: Evidence for a paradox in endurance-trained athletes. J Clin Endocrinol Metab. 2001;86:5755–5761. - PubMed
-
- Pruchnic R, Katsiaras A, He J, Kelley DE, Winters C, et al. Exercise training increases intramyocellular lipid and oxidative capacity in older adults. Am J Physiol Endocrinol Metab. 2004;287:E857–E862. - PubMed
-
- Lowell BB, Shulman GI. Mitochondrial dysfunction and type 2 diabetes. Science. 2005;307:384–387. - PubMed
Publication types
MeSH terms
Substances
LinkOut - more resources
Full Text Sources
Medical

