

Hsp70 chaperone ligands control domain association via an allosteric mechanism mediated by the interdomain linker
- PMID: 17434124
- PMCID: PMC1894942
- DOI: 10.1016/j.molcel.2007.02.020
Hsp70 chaperone ligands control domain association via an allosteric mechanism mediated by the interdomain linker
Abstract
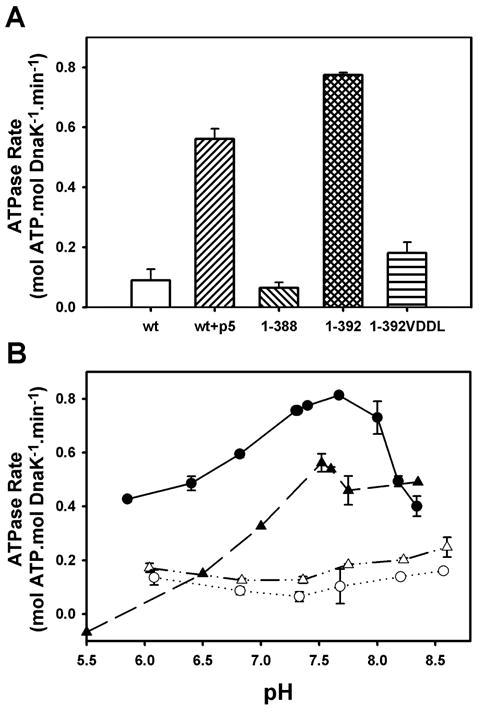
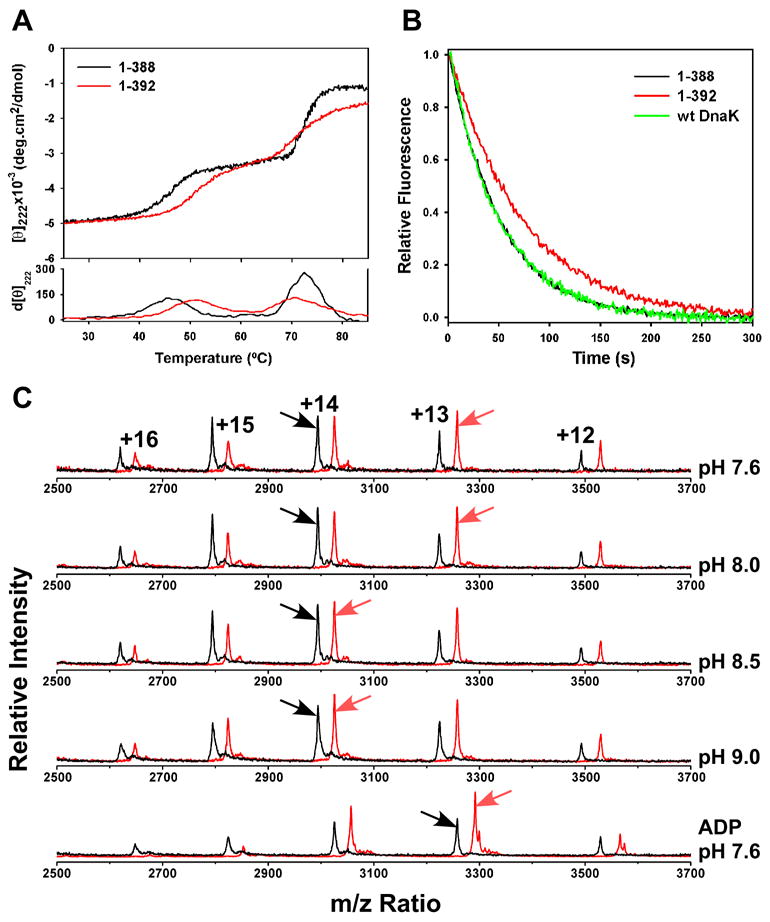
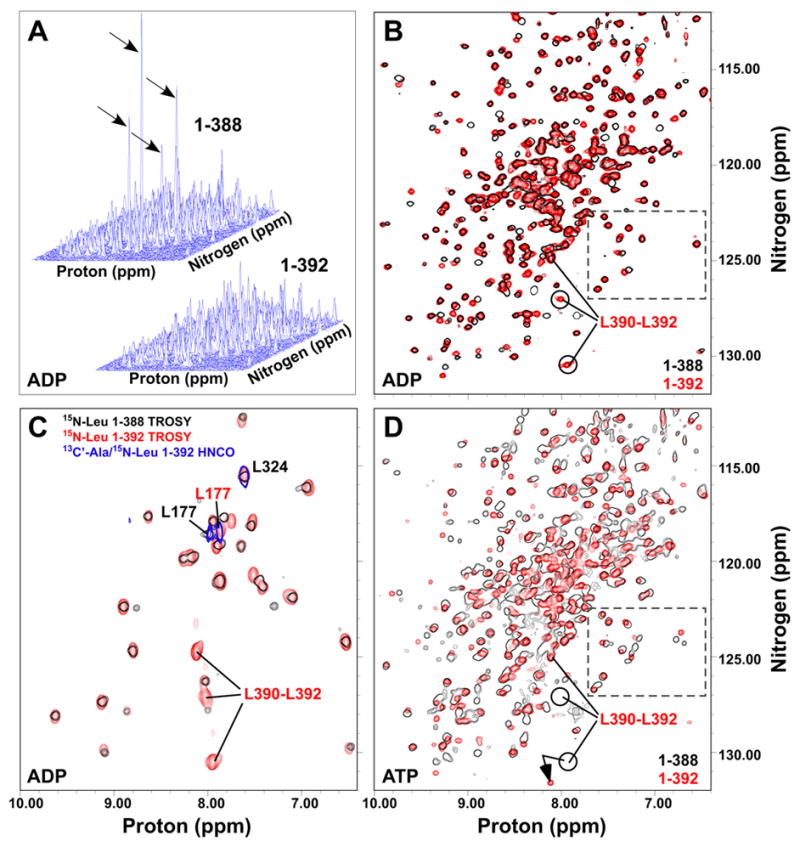
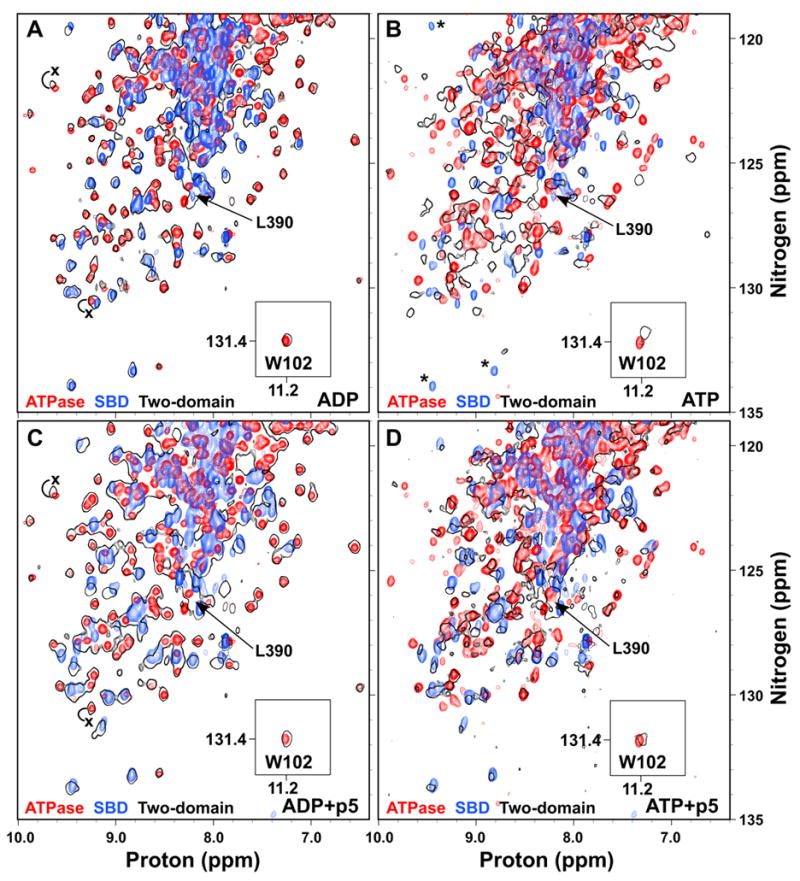
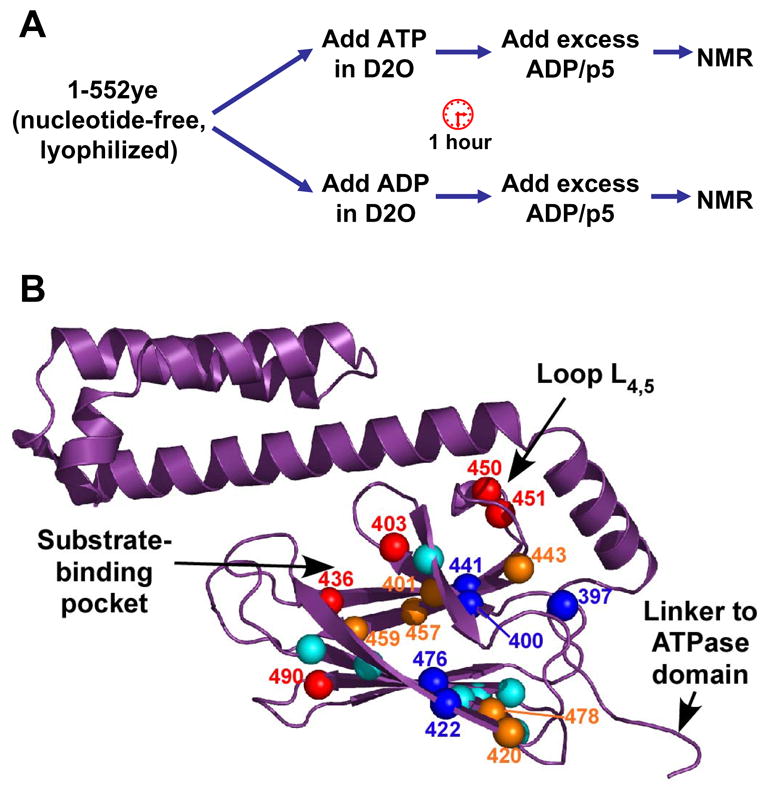
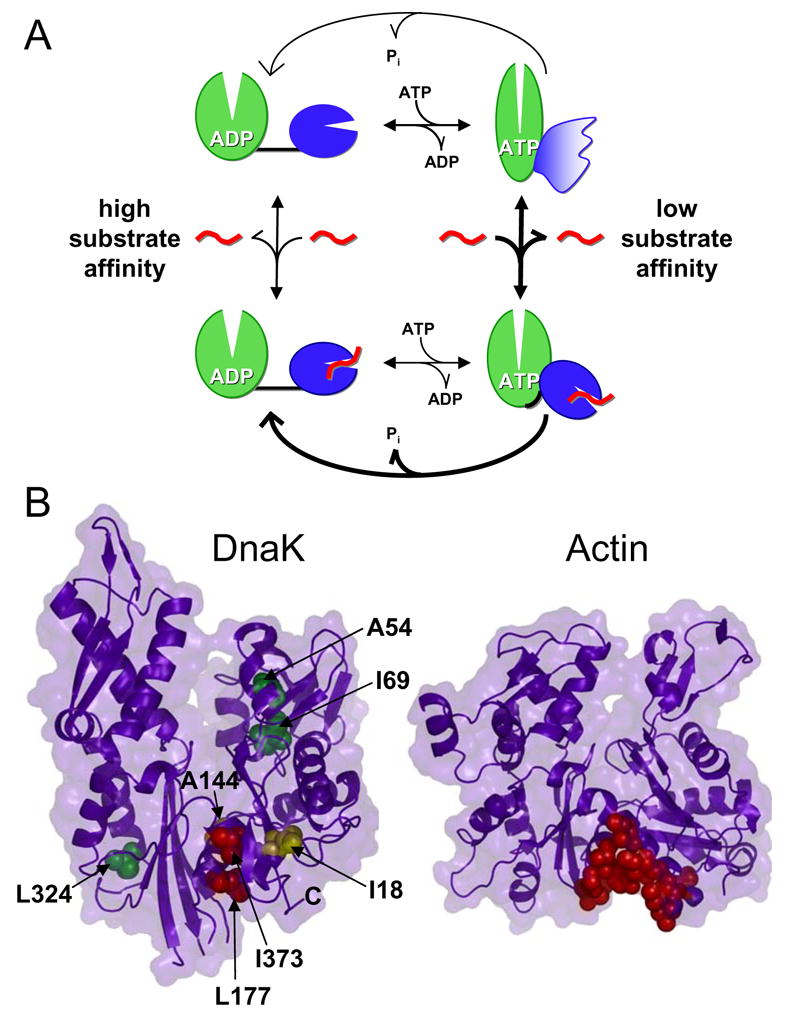
Hsp70 chaperones assist in protein folding, disaggregation, and membrane translocation by binding to substrate proteins with an ATP-regulated affinity that relies on allosteric coupling between ATP-binding and substrate-binding domains. We have studied single- and two-domain versions of the E. coli Hsp70, DnaK, to explore the mechanism of interdomain communication. We show that the interdomain linker controls ATPase activity by binding to a hydrophobic cleft between subdomains IA and IIA. Furthermore, the domains of DnaK dock only when ATP binds and behave independently when ADP is bound. Major conformational changes in both domains accompany ATP-induced docking: of particular importance, some regions of the substrate-binding domain are stabilized, while those near the substrate-binding site become destabilized. Thus, the energy of ATP binding is used to form a stable interface between the nucleotide- and substrate-binding domains, which results in destabilization of regions of the latter domain and consequent weaker substrate binding.
Figures
Similar articles
-
The allosteric transition in DnaK probed by infrared difference spectroscopy. Concerted ATP-induced rearrangement of the substrate binding domain.Protein Sci. 2006 Feb;15(2):223-33. doi: 10.1110/ps.051732706. Epub 2005 Dec 29. Protein Sci. 2006. PMID: 16384998 Free PMC article.
-
Energetics of nucleotide-induced DnaK conformational states.Biochemistry. 2010 Feb 16;49(6):1338-45. doi: 10.1021/bi901847q. Biochemistry. 2010. PMID: 20078127
-
Substrate-binding domain conformational dynamics mediate Hsp70 allostery.Proc Natl Acad Sci U S A. 2015 Jun 2;112(22):E2865-73. doi: 10.1073/pnas.1506692112. Epub 2015 May 18. Proc Natl Acad Sci U S A. 2015. PMID: 26038563 Free PMC article.
-
Hsp70 chaperones: cellular functions and molecular mechanism.Cell Mol Life Sci. 2005 Mar;62(6):670-84. doi: 10.1007/s00018-004-4464-6. Cell Mol Life Sci. 2005. PMID: 15770419 Free PMC article. Review.
-
Intra-molecular pathways of allosteric control in Hsp70s.Philos Trans R Soc Lond B Biol Sci. 2018 Jun 19;373(1749):20170183. doi: 10.1098/rstb.2017.0183. Philos Trans R Soc Lond B Biol Sci. 2018. PMID: 29735737 Free PMC article. Review.
Cited by
-
Constructing fluorogenic Bacillus spores (F-spores) via hydrophobic decoration of coat proteins.PLoS One. 2010 Feb 19;5(2):e9283. doi: 10.1371/journal.pone.0009283. PLoS One. 2010. PMID: 20174569 Free PMC article.
-
Pharmacological targeting of the Hsp70 chaperone.Curr Top Med Chem. 2009;9(15):1337-51. doi: 10.2174/156802609789895674. Curr Top Med Chem. 2009. PMID: 19860737 Free PMC article. Review.
-
Allosteric landscapes of eukaryotic cytoplasmic Hsp70s are shaped by evolutionary tuning of key interfaces.Proc Natl Acad Sci U S A. 2018 Nov 20;115(47):11970-11975. doi: 10.1073/pnas.1811105115. Epub 2018 Nov 5. Proc Natl Acad Sci U S A. 2018. PMID: 30397123 Free PMC article.
-
Engineering and Evolution of Molecular Chaperones and Protein Disaggregases with Enhanced Activity.Front Mol Biosci. 2016 Mar 15;3:8. doi: 10.3389/fmolb.2016.00008. eCollection 2016. Front Mol Biosci. 2016. PMID: 27014702 Free PMC article. Review.
-
Conformation transitions of the polypeptide-binding pocket support an active substrate release from Hsp70s.Nat Commun. 2017 Oct 31;8(1):1201. doi: 10.1038/s41467-017-01310-z. Nat Commun. 2017. PMID: 29084938 Free PMC article.
References
-
- Bartels C, Xia TH, Billeter M, Güntert P, Wüthrich K. The program XEASY for computer-supported NMR spectral analysis of biological macromolecules. J Biomol NMR. 1995;5:1–10. - PubMed
-
- Buchberger A, Theyssen H, Schroder H, McCarty JS, Virgallita G, Milkereit P, Reinstein J, Bukau B. Nucleotide-induced conformational changes in the ATPase and substrate binding domains of the DnaK chaperone provide evidence for interdomain communication. J Biol Chem. 1995;270:16903–16910. - PubMed
-
- Bukau B, Weissman J, Horwich A. Molecular chaperones and protein quality control. Cell. 2006;125:443–451. - PubMed
-
- Chowdhury SK, Katta V, Chait BT. Probing conformational changes in proteins by mass spectrometry. J Amer Chem Soc. 1990;112:9012–9013.
Publication types
MeSH terms
Substances
Grants and funding
LinkOut - more resources
Full Text Sources
Other Literature Sources
Molecular Biology Databases
