Cytomegalovirus infection in Gambian infants leads to profound CD8 T-cell differentiation
- PMID: 17376923
- PMCID: PMC1900274
- DOI: 10.1128/JVI.00052-07
Cytomegalovirus infection in Gambian infants leads to profound CD8 T-cell differentiation
Abstract
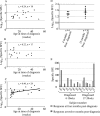
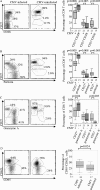
Cytomegalovirus (CMV) infection is endemic in Gambian infants, with 62% infected by 3 months and 85% by 12 months of age. We studied the CD8 T-cell responses of infants to CMV following primary infection. CMV-specific CD8 T cells, identified with tetramers, showed a fully differentiated phenotype (CD28(-) CD62L(-) CD95(+) perforin(+) granzyme A(+) Bcl-2(low)). Strikingly, the overall CD8 T-cell population developed a similar phenotype following CMV infection, which persisted for at least 12 months. In contrast, primary infection was accompanied by up-regulation of markers of activation (CD45R0 and HLA-D) on both CMV-specific cells and the overall CD8 T-cell population and division (Ki-67) of specific cells, but neither pattern persisted. At 12 months of age, the CD8 T-cell population of CMV-infected infants was more differentiated than that of uninfected infants. Although the subpopulation of CMV-specific cells remained constant, the CMV peptide-specific gamma interferon response was lower in younger infants and increased with age. As the CD8 T-cell phenotype induced by CMV is indicative of immune dysfunction in the elderly, the existence of a similar phenotype in large numbers of Gambian infants raises the question of whether CMV induces a similarly deleterious effect.
Figures


Similar articles
-
Maintenance of large subpopulations of differentiated CD8 T-cells two years after cytomegalovirus infection in Gambian infants.PLoS One. 2008 Aug 6;3(8):e2905. doi: 10.1371/journal.pone.0002905. PLoS One. 2008. PMID: 18682836 Free PMC article.
-
Cytomegalovirus infection induces T-cell differentiation without impairing antigen-specific responses in Gambian infants.Immunology. 2008 Jul;124(3):388-400. doi: 10.1111/j.1365-2567.2007.02787.x. Epub 2008 Jan 11. Immunology. 2008. PMID: 18194268 Free PMC article.
-
Impact of HIV on CD8+ T cell CD57 expression is distinct from that of CMV and aging.PLoS One. 2014 Feb 27;9(2):e89444. doi: 10.1371/journal.pone.0089444. eCollection 2014. PLoS One. 2014. PMID: 24586783 Free PMC article.
-
Molecular characterization of HCMV-specific immune responses: Parallels between CD8(+) T cells, CD4(+) T cells, and NK cells.Eur J Immunol. 2015 Sep;45(9):2433-45. doi: 10.1002/eji.201545495. Epub 2015 Aug 24. Eur J Immunol. 2015. PMID: 26228786 Review.
-
The hallmarks of CMV-specific CD8 T-cell differentiation.Med Microbiol Immunol. 2019 Aug;208(3-4):365-373. doi: 10.1007/s00430-019-00608-7. Epub 2019 Apr 13. Med Microbiol Immunol. 2019. PMID: 30989333 Free PMC article. Review.
Cited by
-
From Genesis to Old Age: Exploring the Immune System One Cell at a Time with Flow Cytometry.Biomedicines. 2024 Jul 3;12(7):1469. doi: 10.3390/biomedicines12071469. Biomedicines. 2024. PMID: 39062042 Free PMC article. Review.
-
Human cytomegalovirus seropositivity and its influence on oral rotavirus vaccine immunogenicity: a specific concern for HIV-exposed-uninfected infants.Clin Exp Immunol. 2024 Jun 20;217(1):99-108. doi: 10.1093/cei/uxae029. Clin Exp Immunol. 2024. PMID: 38546123 Free PMC article.
-
Immune-Ageing Evaluation of Peripheral T and NK Lymphocyte Subsets in Chinese Healthy Adults.Phenomics. 2023 May 23;3(4):360-374. doi: 10.1007/s43657-023-00106-0. eCollection 2023 Aug. Phenomics. 2023. PMID: 37589027 Free PMC article.
-
Cytomegalovirus Seropositivity in Older Adults Changes the T Cell Repertoire but Does Not Prevent Antibody or Cellular Responses to SARS-CoV-2 Vaccination.J Immunol. 2022 Nov 15;209(10):1892-1905. doi: 10.4049/jimmunol.2200369. J Immunol. 2022. PMID: 36426948 Free PMC article.
-
NK Cell Subset Redistribution and Antibody Dependent Activation after Ebola Vaccination in Africans.Vaccines (Basel). 2022 May 31;10(6):884. doi: 10.3390/vaccines10060884. Vaccines (Basel). 2022. PMID: 35746491 Free PMC article.
References
-
- Appay, V., P. R. Dunbar, M. Callan, P. Klenerman, G. M. Gillespie, L. Papagno, G. S. Ogg, A. King, F. Lechner, C. A. Spina, S. Little, D. V. Havlir, D. D. Richman, N. Gruener, G. Pape, A. Waters, P. Easterbrook, M. Salio, V. Cerundolo, A. J. McMichael, and S. L. Rowland-Jones. 2002. Memory CD8+ T cells vary in differentiation phenotype in different persistent virus infections. Nat. Med. 8:379-385. - PubMed
-
- Budd, R. 2001. Activation-induced cell death. Curr. Opin. Immunol. 13:356-362. - PubMed
-
- Bunce, M., C. O'Neill, M. Barnardo, P. Krausa, M. Browning, P. Morris, and K. Welsh. 1995. Phototyping: comprehensive DNA typing for HLA-A, B, C, DRB1, DRB3, DRB4, DRB5 and DQB1 by PCR with 144 primer mixes utilizing sequence-specific primers (PCR-SSP). Tissue Antigens 46:355-367. - PubMed
-
- Bunde, T., A. Kirchner, B. Hoffmeister, D. Habedank, R. Hetzer, G. Cherepnev, S. Proesch, P. Reinke, H.-D. Volk, H. Lehmkuhl, and F. Kern. 2005. Protection from cytomegalovirus after transplantation is correlated with immediate early 1-specific CD8 T cells. J. Exp. Med. 201:1031-1036. - PMC - PubMed
Publication types
MeSH terms
Grants and funding
LinkOut - more resources
Full Text Sources
Medical
Research Materials

