. 2007 Jun;27(11):3982-94.
doi: 10.1128/MCB.00170-07. Epub 2007 Mar 19.

Cross talk between notch and growth factor/cytokine signaling pathways in neural stem cells

Affiliations

Cross talk between notch and growth factor/cytokine signaling pathways in neural stem cells

Motoshi Nagao et al. Mol Cell Biol. 2007 Jun.

Abstract

Precise control of proliferation and differentiation of multipotent neural stem cells (NSCs) is crucial for proper development of the nervous system. Although signaling through the cell surface receptor Notch has been implicated in many aspects of neural development, its role in NSCs remains elusive. Here we examined how the Notch pathway cross talks with signaling for growth factors and cytokines in controlling the self-renewal and differentiation of NSCs. Both Notch and growth factors were required for active proliferation of NSCs, but each of these signals was sufficient and independent of the other to inhibit differentiation of neurons and glia. Moreover, Notch signals could support the clonal self-renewing growth of NSCs in the absence of growth factors. This growth factor-independent action of Notch involved the regulation of the cell cycle and cell-cell interactions. During differentiation of NSCs, Notch signals promoted the generation of astrocytes in collaboration with ciliary neurotrophic factor and growth factors. Their cooperative actions were likely through synergistic phosphorylation of signal transducer and activator of transcription 3 on tyrosine at position 705 and serine at position 727. Our data suggest that distinct intracellular signaling pathways operate downstream of Notch for the self-renewal of NSCs and stimulation of astrogenesis.


Figures

FIG. 1.
FIG. 1.
Neurosphere culture of embryonic forebrain NSCs and manipulation of Notch signaling by retrovirus-mediated gene transfer. (A and A′) Bright-field (A) and fluorescence (A′) images of a neurosphere stained for nestin (red). (B) Clonal expansion of neurospheres in a methylcellulose matrix. (C and C′) Differentiation of neurospheres into neurons and glia. Bright-field (C) and fluorescence (C′) images of a neurosphere stained for TuJ1 (red), GFAP (blue), and O4 (green) are shown. Cells were induced to differentiate for 6 days in PDL-coated glass chambers. Bars, 100 μm. (D) Time course of differentiation of neurons and glia on monolayers. The percentages of nestin-positive, Sox2-positive, TuJ1-positive, GFAP-positive, and O4-positive cells among total cells are shown (means ± SD; n = 3). (E) Time course of the emergence of Mash1-positive, Ngn2-positive, and Prox1-positive cells (means ± SD; n = 3). (F) Schematic diagram showing the temporal sequence of differentiation of NSCs. (G to G″) Bright-field (G), GFP fluorescence (green) (G′), and nestin staining (red) (G″) images of a neurosphere infected with pMXIG retrovirus. Bar, 100 μm. (H to K) Stable expression of GFP in neuronal and glial progeny of virus-infected neurospheres. Virus-infected cells were double stained for GFP (green) together with nestin (H), TuJ1 (I), GFAP (J), and O4 (K) (red). Arrows indicate double-positive cells. Bar, 50 μm. (L) Schematic diagram of the deletion constructs of Notch1 and Dll1. ca-Notch1 and ca-Notch1ΔRAM contain a Flag tag at their N termini. ANKR, six ankyrin-like repeats; RAM, RAM domain; TM, transmembrane domain.
FIG. 2.
FIG. 2.
Regulation of NSC differentiation by Notch signaling. (A to C) Effect of early-step modulation of Notch signaling on differentiation of NSCs. Neurospheres were infected with retroviruses according to the early-infection protocol. Treatment with DAPT (1 μM) was performed for the last 6 days. The cells were subjected to immunostaining for nestin, TuJ1, GFAP, and O4 at DAP6 (A); for Sox2 at DAP0, DAP2, and DAP6 (B); and for Mash1 and Prox1 at DAP0 and DAP2 (C). Data are the percentages of marker-positive cells among total GFP-positive cells (means ± SD; n = 3 to 7 (*, P < 0.01; **, P < 0.05 [compared to control virus-infected cells]). (D and E) Effect of late-step modulation of Notch signaling on differentiation of NSCs. Neurospheres were infected with viruses according to the late-infection protocol. Panel D shows the percentages of individual marker-positive cells among total GFP-positive cells, whereas panel E shows the sum of differentiated cells (means ± SD; n = 3 to 6) (*, P < 0.01; **, P < 0.05 [compared to control virus-infected cells]).
FIG. 3.
FIG. 3.
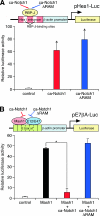
Distinct signaling activities of ca-Notch1 and ca-Notch1ΔRAM. Activation of the Hes1 promoter-containing reporter pHes1-Luc (A) and inhibition of Mash1-dependent transcriptional activation of the E-box-containing reporter pE7βA-Luc (B) were examined in the neuroepithelial cell line MNS-70. Upper diagrams show schematic representations of the reporter constructs. All data are means ± SD (n = 3). *, P < 0.01 compared to cells transfected with the control (A) or Mash1-expressing (B) plasmid.
FIG. 4.
FIG. 4.
Independent actions of Notch and GF signals on differentiation of NSCs. (A) Effect of GFs on the differentiation of NSCs. Control virus-infected cells were cultured in the presence or absence of GFs, and the percentages of marker-positive cells among GFP-positive cells were quantified (means ± SD; n = 3) (*, P < 0.01). (B) Inhibition of the early differentiation step by GFs. Dissociated cells were treated with GFs for 0 (solid circles), 1 (hatched circles), or 2 (open circles) days. Subsequently, the culture was continued without GFs, and the time course of the emergence of Mash1-positive cells was examined. (C to E) Notch-independent action of GFs. The patterns of induction of Mash1-positive (C) and TuJ1-positive (D and E) cells were compared among different conditions. In panels C and D, cells infected with control and dn-Dll1 viruses were cultured with or without GFs. In panel E, control virus-infected cells were treated with DAPT (1 μM) or mock solution for 4 days.
FIG. 5.
FIG. 5.
GF-independent actions of Notch in NSCs. (A and B) Regulation of self-renewal by Notch. Virus-infected cells were cultured at a clonal density (10 cells/μl) in a methylcellulose matrix for 7 days in the presence of GFs, and the number of clonal spheres formed per 1 × 10⁴ cells was quantified. (C to C‴) GF-independent action of ca-Notch1 in neurosphere formation. Virus-infected cells were cultured for 21 days without GFs. (C) Number of GFP-positive spheres formed per 1 × 10⁴ cells. (C′ to C‴) Bright-field (C′), GFP fluorescence (green) (C″), and nestin staining (red) (C‴) images of a ca-Notch1-expressing neurosphere formed without GFs. Bar, 50 μm. (D) Notch-dependent formation of floating colonies without GFs. Virus-infected cells were cultured at a high density (50 cells/μl) for 21 days without GFs, and the number of floating colonies formed per 1 × 10⁴ cells was quantified. Treatment with DAPT (1 μM) was continued throughout the course of culture. (E and F) GF-independent formation of neurospheres by ca-Notch1-expressing cells. (E) Cells were cultured at a clonal density for 7 days in the presence of FGF2 (5 ng/ml) or EGF (5 ng/ml) with or without SU5402 (25 μM) and PD168393 (25 nM). The frequency of neurosphere formation is shown as the percent value of the inhibitor-untreated culture. (F) Cells infected with ca-Notch1 viruses were cultured at a clonal density for 21 days without GFs. The frequencies of neurosphere formation in cultures treated with SU5402, PD168393, and their combination were compared with that in untreated culture. All data are means ± SD (n = 3 to 6). *, P < 0.01; **, P < 0.05 (compared to cells infected with control viruses [A to D] or non-inhibitor-treated culture [E and F]).
FIG. 6.
FIG. 6.
Control of cell adhesion and cell cycle progression by Notch signaling. (A to C) Notch-dependent clustering of clonally growing cells on the adhesive surface. The cells were cultured on the adhesive culture surface at a clonal density in a methylcellulose matrix in the presence of GFs. (A to B′) Bright-field (A and B) and fluorescence (A′ and B′) images of colonies of control (A and A′) and ca-Notch1-expressing (B and B′) cells. Bar, 100 μm. Arrows and arrowheads indicate GFP-positive and GFP-negative cells, respectively. (C) Percentage of cell clusters formed by control and ca-Notch1-expressing cells at 1 and 3 weeks after plating. (D) Slow growth of ca-Notch1-expressing neurospheres. Cells infected with control and ca-Notch1 viruses were cultured for 7 days in the presence of GFs. The histogram compares the frequencies of neurospheres with different diameters (percentage of total GFP-positive spheres examined). (E) Regulation of the cell cycle by Notch. Cells infected with control and ca-Notch1 viruses were cultured with (+) or without (−) GFs for 2 days. The cells were labeled with BrdU for 2 h, and the percentages of BrdU-positive and p27-positive cells among GFP-positive cells were quantified. All data in panels C to E are means ± SD (n = 3 to 6). *, P < 0.01 compared to control virus-infected cells.
FIG. 7.
FIG. 7.
Cross talk between Notch, GF, and CNTF signaling pathways in astrocyte differentiation. (A to C) Modulation of CNTF- and BMP-dependent induction of astrocytes by Notch signaling. The percentages of GFAP-positive (A), TuJ1-positive (B), and O4-positive (C) cells were compared among cultures treated with and without (−) CNTF or BMP4 for 6 days (means ± SD; n = 3 to 5) (*, P < 0.01; **, P < 0.05 [between different treatment conditions of cells infected with the same viruses or between data paired by lines]). (D) Notch-dependent action of CNTF. The effect of DAPT on CNTF-induced differentiation of astrocytes is shown (means ± SD, n = 3) (*, P < 0.01). + and −, with and without treatment, respectively. (E) Synergistic actions of CNTF and GFs. The effects of GFs and CNTF on differentiation of astrocytes are shown (means ± SD; n = 3) (*, P < 0.01). (F) Inhibition of neurosphere formation by CNTF. The frequencies of neurosphere formation with or without treatment with CNTF were compared (means ± SD; n = 6) (*, P < 0.01; **, P < 0.05 [between CNTF-treated and untreated cells infected with the same viruses or between data paired by lines]).
FIG. 8.
FIG. 8.
Synergistic actions of Notch, GFs, and CNTF on phosphorylation of STAT3. (A to H) Nuclear accumulation of phosphorylated STAT3 in response to Notch and CNTF signals. Cells infected with control and ca-Notch1 viruses were treated with or without CNTF for 30 min and subsequently double stained for GFP (green) and STAT3-pS727 (red) (A to D) or GFP and STAT3-pY705 (E to H). Arrows indicate double-positive cells. Bar, 25 μm. (I) Synergistic actions of Notch, GFs, and CNTF on phosphorylation of STAT3. The percentages of cells stained for STAT3-pS727 (left) and STAT3-pY705 (right) in the nucleus were quantified (means ± SD; n = 3) (*, P < 0.01 between treated and untreated cells infected with the same viruses or between data paired by lines). (J) Developmental change in the phosphorylation status of STAT3. The overall protein level of STAT3 and the status of its phosphorylation on S727 and Y705 were compared between forebrain neuroepithelial cells derived from E13.5, E15.5, and E18.5 embryos (left), and CNTF-treated and untreated neurospheres (right). Lamin B was used as a loading control.
FIG. 9.
FIG. 9.
Model for cross talk between signaling pathways for Notch, GFs, and CNTF in NSCs. This model proposes that Notch signaling regulates the growth and differentiation of NSCs at two distinct steps through cross talk with CNTF and GF signals. During early development (left), both Notch and GF signals are required for active self-renewing growth, whereas they inhibit differentiation of NSCs independently from each other. Notch signals also regulate the cell-cell interactions and cell cycle independently of GFs. Later in development (right), Notch, GFs, and CNTF collaborate to promote differentiation of astrocytes. A, astrocyte; IP, intermediate progenitor; N, neuron; O, oligodendrocyte.

Similar articles

Cited by

References

    1. Androutsellis-Theotokis, A., R. R. Leker, F. Soldner, D. J. Hoeppner, R. Ravin, S. W. Poser, M. A. Rueger, S. K. Bae, R. Kittappa, and R. D. McKay. 2006. Notch signalling regulates stem cell numbers in vitro and in vivo. Nature 442:823-826. - PubMed
    1. Aster, J. C., E. S. Robertson, R. P. Hasserjian, J. R. Turner, E. Kieff, and J. Sklar. 1997. Oncogenic forms of NOTCH1 lacking either the primary binding site for RBP-Jκ or nuclear localization sequences retain the ability to associate with RBP-Jκ and activate transcription. J. Biol. Chem. 272:11336-11343. - PubMed
    1. Barnabe-Heider, F., J. A. Wasylnka, K. J. Fernandes, C. Porsche, M. Sendtner, D. R. Kaplan, and F. D. Miller. 2005. Evidence that embryonic neurons regulate the onset of cortical gliogenesis via cardiotrophin-1. Neuron 48:253-265. - PubMed
    1. Bauer, S., and P. H. Patterson. 2006. Leukemia inhibitory factor promotes neural stem cell self-renewal in the adult brain. J. Neurosci. 26:12089-12099. - PMC - PubMed
    1. Bertrand, N., D. S. Castro, and F. Guillemot. 2002. Proneural genes and the specification of neural cell types. Nat. Rev. Neurosci. 3:517-530. - PubMed

Publication types

MeSH terms

Substances

LinkOut - more resources