Comparative Study
. 2007 Mar 14;27(11):2815-24.
doi: 10.1523/JNEUROSCI.0032-07.2007.

Silencing of neuroligin function by postsynaptic neurexins

Affiliations
Comparative Study

Silencing of neuroligin function by postsynaptic neurexins

Hiroki Taniguchi et al. J Neurosci. .

Abstract

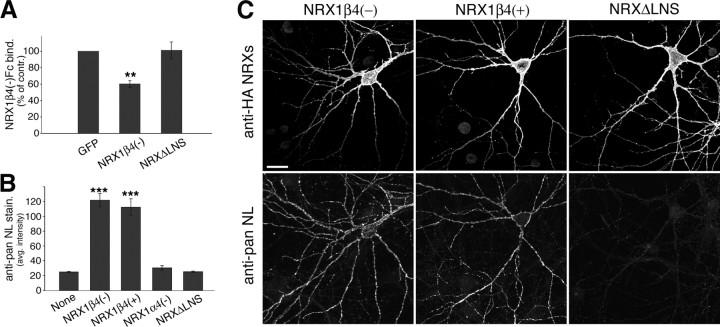
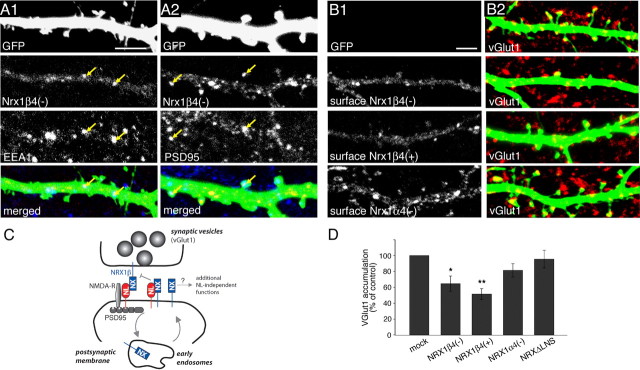
The formation of neuronal circuits during development involves a combination of synapse stabilization and elimination events. Synaptic adhesion molecules are thought to play an important role in synaptogenesis, and several trans-synaptic adhesion systems that promote the formation and maturation of synapses have been identified. The neuroligin-neurexin complex is a heterophilic adhesion system that promotes assembly and maturation of synapses through bidirectional signaling. In this protein complex, postsynaptic neuroligins are thought to interact trans-synaptically with presynaptic neurexins. However, the subcellular localization of neurexins has not been determined. Using immunoelectron microscopy, we found that endogenous neurexins and epitope-tagged neurexin-1beta are localized to axons and presynaptic terminals in vivo. Unexpectedly, neurexins are also abundant in the postsynaptic density. cis-expression of neurexin-1beta with neuroligin-1 inhibits trans-binding to recombinant neurexins, blocks the synaptogenic activity of neuroligin-1, and reduces the density of presynaptic terminals in cultured hippocampal neurons. Our results demonstrate that the function of neurexin proteins is more diverse than previously anticipated and suggest that postsynaptic cis-interactions might provide a novel mechanism for silencing the activity of a synaptic adhesion complex.


Figures

Figure 1.
Figure 1.
Ultrastructural localization of neurexins in P7 and P8 cerebral cortices and cerebellum of rats as visualized by the HRP–DAB and PEG immunolabels. Using a pan-neurexin antibody followed by HRP–DAB and PEG immunolabels, the variety of perisynaptic positions taken by neurexin is shown. A, HRP–DAB revealed neurexin labeling within many axons of the molecular layer of P7 cerebellum, one example of which is shown here (l-ax). Immediately adjacent to l-ax is an example of dense immunolabeling that occurs along the postsynaptic membrane and intracellularly within spines (l-sp). In contrast, the axon terminal that is presynaptic to the labeled spine is unlabeled (t). Scale bar, 500 nm (also applies to B). Arrows here and in all other panels point to the postsynaptic density. Tissue for this analysis was fixed with 4% paraformaldehyde. Subsequent to the immunocytochemical procedure, the vibratome sections were fixed using 1% glutaraldehyde, followed by 1% osmium tetroxide and counterstaining with 1% uranyl acetate. The light microscopic images of the vibratome section from which these ultrathin sections were sampled are shown in supplemental Figure S1 (available at www.jneurosci.org as supplemental material). B, Vibratome section of P7 cerebellum taken semi-adjacent incubated using the same pan-neurexin antibody that was preabsorbed with the antigen. Immunolabeling was eliminated from spines and axons. C–E, Clusters of immunogold labeling achieved at the PEG stage occur discretely along the plasma membrane of synapses in the infragranular layers of P7 cerebral cortex. C shows an example of PEG particles at and near the presynaptic membrane of an axon terminal (t) and in the cleft. D and E show clusters of PEG particles along the postsynaptic membrane and PSD of dendritic spines (sp) and the synaptic cleft. E shows additional PEG clustered along the spine apparatus and presynaptic terminal (t). Scale bar, 200 nm (also applies to C–E). F, The PEG particle distribution was analyzed relative to synaptic junctions. PEG positions were measured as distance, in nanometers, from the postsynaptic membrane, and all PEG particles were counted in mutually exclusive bins (0–10, 10–20, 20–30 nm, etc.). These distances span six categories described to the left of the diagram as “Within Terminals,” “At/Near Presynaptic Membrane,” “At cleft,” “At PSD,” “Near PSD” (and along the postsynaptic membrane), and “Within Spines” (but away from the PSD). This analysis was based on 419 PEG particles that were associated with 111 labeled synapses showing clear presentation of the synaptic cleft. The labeled synapses were encountered across four grids.
Figure 2.
Figure 2.
Epitope-tagged neurexin-1β is detected in axons and dendrites. A, Schematic representation of GFP-tagged NRX1β4(+) used to generate transgenic mice. The EGFP sequence was inserted into the extracellular stalk domain of neurexin. The insertion at splice site 4 is marked as 4(+), and the LNS domain and transmembrane domain (TMD) are marked. B, Detection of GFP–NRX1β4(+) (anti-GFP, green) in dentate granule cells at P10, triple stained for calbindin (red) and Hoechst (blue). Scale bar, 100 μm. C, Detection of GFP–NRX1β4(+)-expressing pyramidal neurons (anti-GFP, green) in the cortex of P10 mouse brains. Nuclei are stained with Hoechst dye (blue). Scale bar, 100 μm. D, E, GFP–NRX1β4(+) localization was probed by EM using anti-GFP and SIG as electron-dense labels for EM. D shows an example of labeling along the plasma membrane of axons (Ax) in the molecular layer of the dentate gyrus. Most of the labeling was in preterminal portions of axons, such as these. E shows an example of SIG particles clustered along the postsynaptic density (lower of two asterisks) that is postsynaptic to an axon terminal (T) in the molecular layer of the dentate gyrus. Scale bar, 500 nm. No significant labeling was observed with the anti-GFP antibodies when wild-type tissue was probed (supplemental Fig. S1B, available at www.jneurosci.org as supplemental material).
Figure 3.
Figure 3.
cis-expression of neurexins reduces synaptogenic activity of neuroligin-1 in hippocampal neurons. A, Hippocampal neurons were cotransfected with VSV-epitope-tagged NL1 and different HA-epitope-tagged NRX1 expression constructs at 10 DIV and were analyzed 2 d later. For these experiments, the NL1 splice variant containing A and B splice insertions was used because this is the most abundant variant endogenously expressed in hippocampal neurons. Examples of transfected cells for the following conditions are shown: NL1 alone, NL1 plus NRX1β4(−),NL1 plus NRX1β4(+), NL1 plus NRX1α4(−), and NL1 plus NRXΔLNS. Left column, Immunostaining for the VSV epitope in NL1; middle column, immunostaining for the HA epitope in the NRXs; right column, immunostaining for the synaptic vesicle marker VAMP2/synaptobrevin. The staining for NL and NRX isoforms was performed in nonpermeabilized cells, and images for all conditions were recorded with identical confocal acquisition settings. Scale bar, 50 μm. B, Quantification of VAMP2 immunoreactivity on the transfected cells, normalized to control cells overexpressing only NL1. Similar results were obtained in at least three independent experiments with at least 10 cells measured per condition in each experiment. Data from one experiment are shown (number of cells per condition, n = 10; **p < 0.01, ***p < 0.001). C, Quantification of average NL1 cell surface staining intensity in dendrites of neurons expressing NL1 alone or together with neurexin isoforms (n = 10 cells; **p < 0.01).
Figure 4.
Figure 4.
cis-expressed neurexins directly block synaptogenic activity of neuroligin-1. A, HEK293 cells cotransfected with NL1 and different NRX cDNAs were added to hippocampal neurons at 10 DIV, and cocultures were maintained for 2 d. The following DNAs were transfected: NL1 alone (mock), NL1 plus NRX1β4(−), NL1 plus NRX1β4(+), and NL1 plus NRX1α4(−). Cultures were immunostained for the VSV epitope on NL1 (left), the HA epitope on NRXs (middle), and VAMP2 to detect synaptic vesicles (right). Scale bar, 10 μm. B, Quantification of the VAMP2 accumulation under the HEK293 cells, expressed as percentage of the signal obtained with cells expressing only NL1. Similar results were obtained in at least three independent experiments for at least 10 cells per condition in each experiment. Data from one experiment are shown (n = 10; *p < 0.05, ***p < 0.001). The NL1 cell surface expression levels were measured by quantification of anti-VSV staining intensity on the transfected HEK293 cells (see Fig. S2A, available at www.jneurosci.org as supplemental material) (n = 10; p > 0.05). C, Neurexin binding was quantified as the average NRX1β4(−)–Fc staining intensity in the transfected HEK293 cells. Similar results were obtained in at least three independent experiments for at least 10 cells per condition in each experiment. Data from one experiment are shown (n = 10; *p < 0.05, **p < 0.01, ***p < 0.001). Images of the cell-binding experiments are shown in supplemental Figure S2B (available at www.jneurosci.org as supplemental material).
Figure 5.
Figure 5.
β-Neurexin overexpression results in upregulation of neuroligins in cis. A, Quantification of NRX1β4(−)–Fc binding to control cells (EGFP), cells expressing NRX1β4(−), and cells expressing NRXΔLNS (binding is expressed as percentage of binding observed in control cells transfected with EGFP alone; n = 20 cells; **p < 0.01). B, Quantification of average pan-NL staining intensity on neurexin-expressing cells and control cells (“None”) (n = 10; ***p < 0.001). C, Hippocampal neurons were transfected with EGFP or different neurexin isoforms at 12 DIV and analyzed 2 d later. Cells were coimmunostained with antibodies to the HA epitope on the transfected neurexins (top row) and with anti-pan-NL antibodies (bottom row). Images of the following transfection conditions are shown: NRX1β4(−), NRX1β4(+), and NRXΔLNS. Note that the pan-NL antibody does detect endogenous neuroligin staining but that this staining is barely visible in these images. Because of the strong increase in endogenous neuroligin staining on the neurexin-expressing cells, confocal settings had to be set such that pan-NL staining in the nontransfected cells is very dim. For an image of endogenous NL staining in control cells, see Figure S3 (available at www.jneurosci.org as supplemental material). Scale bar, 20 μm.
Figure 6.
Figure 6.
Dendritic neurexin expression reduces vGlut1 clustering and neurexin binding in dissociated hippocampal neurons. A1, A2, Dissociated hippocampal neurons were cotransfected with expression constructs for EGFP and HA–NRX1β4(−) at 14–15 DIV and analyzed by immunohistochemistry at 17 DIV. Cells were triple immunostained with anti-GFP (green), anti-HA (red), and anti-EEA1 antibodies (A1, blue) or anti-PSD95 antibodies (A2, blue). Some punctate structures that are colabeled for the tagged neurexin and EEA1 or PSD95 are marked by arrows. Images shown are projected confocal image stacks, but colocalization was also observed when single optical sections were examined at high magnification (data not shown). Scale bar, 5 μm. B1, B2, Hippocampal neurons at 12 DIV were cotransfected with EGFP and with the different NRX isoforms and analyzed 2 d later. Before permeabilization, fixed cells were stained with anti-HA antibodies to detect cell surface distributions of HA-tagged NRX isoforms NRX1β4(−), NRX1β4(+), and NRX1α4(−) (shown in B1). Subsequently, cells were permeabilized and glutamatergic presynaptic sites were labeled with antibodies to vGlut1 (red), and transfected cells were visualized by EGFP (green) that had been cotransfected with the NRX isoforms (shown in B2). Scale bar, 5 μm. C, Hypothetical model for postsynaptic β-neurexin function. Postsynaptic NL1 interacts trans-synaptically with NRX1 β. A pool of postsynaptic NL1 associates with NRX1β in the postsynaptic membrane in cis and therefore is not available for trans-synaptic binding. In dendrites, additional NRX1β molecules are present in early endosomal structures (EEA1-positive) from where they may recycle over the cell surface. D, Quantification of vGlut1 cluster density on transfected cells (expressed as percentage of control cells transfected with EGFP alone; n = 10; *p < 0.05, **p < 0.01).

Similar articles

Cited by

References

    1. Aoki C, Miko I, Oviedo H, Mikeladze-Dvali T, Alexandre L, Sweeney N, Bredt DS. Electron microscopic immunocytochemical detection of PSD-95, PSD-93, SAP-102, and SAP-97 at postsynaptic, presynaptic, and nonsynaptic sites of adult and neonatal rat visual cortex. Synapse. 2001;40:239–257. - PubMed
    1. Aoki C, Sekino Y, Hanamura K, Fujisawa S, Mahadomrongkul V, Ren Y, Shirao T. Drebrin A is a postsynaptic protein that localizes in vivo to the submembranous surface of dendritic sites forming excitatory synapses. J Comp Neurol. 2005;483:383–402. - PubMed
    1. Benson DL, Colman DR, Huntley GW. Molecules, maps and synapse specificity. Nat Rev Neurosci. 2001;2:899–909. - PubMed
    1. Biederer T, Scheiffele P. Mixed-culture assays for analyzing neuronal synapse formation. Nat Protoc. 2007 in press. - PubMed
    1. Boucard AA, Chubykin AA, Comoletti D, Taylor P, Südhof TC. A splice code for trans-synaptic cell adhesion mediated by binding of neuroligin 1 to alpha- and beta-neurexins. Neuron. 2005;48:229–236. - PubMed

Publication types

MeSH terms