

Human polymorphism at microRNAs and microRNA target sites
- PMID: 17360642
- PMCID: PMC1805605
- DOI: 10.1073/pnas.0611347104
Human polymorphism at microRNAs and microRNA target sites
Abstract
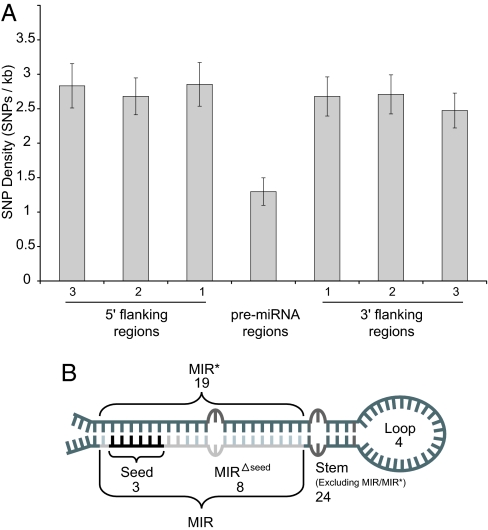
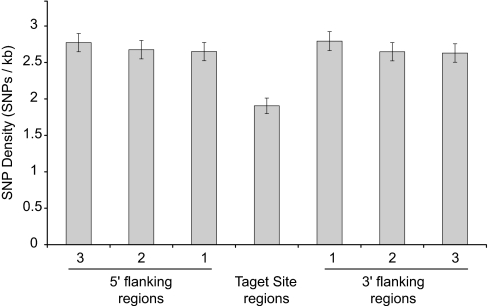
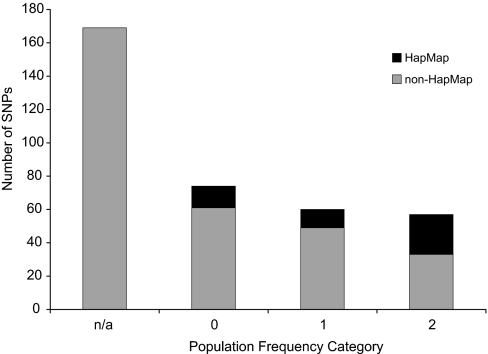
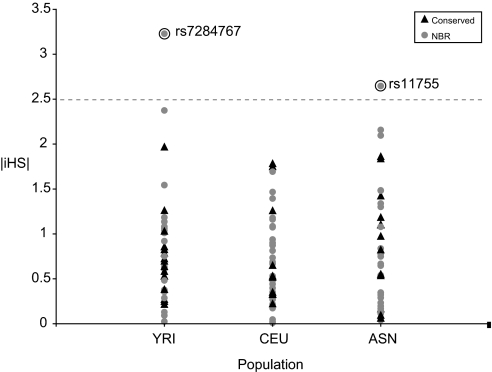
MicroRNAs (miRNAs) function as endogenous translational repressors of protein-coding genes in animals by binding to target sites in the 3' UTRs of mRNAs. Because a single nucleotide change in the sequence of a target site can affect miRNA regulation, naturally occurring SNPs in target sites are candidates for functional variation that may be of interest for biomedical applications and evolutionary studies. However, little is known to date about variation among humans at miRNAs and their target sites. In this study, we analyzed publicly available SNP data in context with miRNAs and their target sites throughout the human genome, and we found a relatively low level of variation in functional regions of miRNAs, but an appreciable level of variation at target sites. Approximately 400 SNPs were found at experimentally verified target sites or predicted target sites that are otherwise evolutionarily conserved across mammals. Moreover, approximately 250 SNPs potentially create novel target sites for miRNAs in humans. If some variants have functional effects, they might confer phenotypic differences among humans. Although the majority of these SNPs appear to be evolving under neutrality, interestingly, some of these SNPs are found at relatively high population frequencies even in experimentally verified targets, and a few variants are associated with atypically long-range haplotypes that may have been subject to recent positive selection.
Conflict of interest statement
The authors declare no conflict of interest.
Figures
Similar articles
-
Systematic analysis of microRNA targeting impacted by small insertions and deletions in human genome.PLoS One. 2012;7(9):e46176. doi: 10.1371/journal.pone.0046176. Epub 2012 Sep 25. PLoS One. 2012. PMID: 23049969 Free PMC article.
-
Identification of common carp (Cyprinus carpio) microRNAs and microRNA-related SNPs.BMC Genomics. 2012 Aug 21;13:413. doi: 10.1186/1471-2164-13-413. BMC Genomics. 2012. PMID: 22908890 Free PMC article.
-
Combination of microRNA expression profiling with genome-wide SNP genotyping to construct a coronary artery disease-related miRNA-miRNA synergistic network.Biosci Trends. 2014 Dec;8(6):297-307. doi: 10.5582/bst.2014.01031. Biosci Trends. 2014. PMID: 25641175
-
A comprehensive review of microRNA-related polymorphisms in gastric cancer.Genet Mol Res. 2016 Jul 14;15(2). doi: 10.4238/gmr.15028289. Genet Mol Res. 2016. PMID: 27421013 Review.
-
A review of databases predicting the effects of SNPs in miRNA genes or miRNA-binding sites.Brief Bioinform. 2019 May 21;20(3):1011-1020. doi: 10.1093/bib/bbx155. Brief Bioinform. 2019. PMID: 29186316 Review.
Cited by
-
SNPing cancer in the bud: microRNA and microRNA-target site polymorphisms as diagnostic and prognostic biomarkers in cancer.Pharmacol Ther. 2013 Jan;137(1):55-63. doi: 10.1016/j.pharmthera.2012.08.016. Epub 2012 Sep 3. Pharmacol Ther. 2013. PMID: 22964086 Free PMC article. Review.
-
Extent, causes, and consequences of small RNA expression variation in human adipose tissue.PLoS Genet. 2012;8(5):e1002704. doi: 10.1371/journal.pgen.1002704. Epub 2012 May 10. PLoS Genet. 2012. PMID: 22589741 Free PMC article.
-
Mir-196a-2 C>T polymorphism as a susceptibility factor for colorectal cancer.Int J Clin Exp Med. 2015 Feb 15;8(2):2600-6. eCollection 2015. Int J Clin Exp Med. 2015. PMID: 25932207 Free PMC article.
-
Integrative QTL mapping and selection signatures in Groningen White Headed cattle inferred from whole-genome sequences.PLoS One. 2022 Oct 26;17(10):e0276309. doi: 10.1371/journal.pone.0276309. eCollection 2022. PLoS One. 2022. PMID: 36288367 Free PMC article.
-
Brain derived neurotrophic factor (BDNF) expression is regulated by microRNAs miR-26a and miR-26b allele-specific binding.PLoS One. 2011;6(12):e28656. doi: 10.1371/journal.pone.0028656. Epub 2011 Dec 14. PLoS One. 2011. PMID: 22194877 Free PMC article.
References
Publication types
MeSH terms
Substances
LinkOut - more resources
Full Text Sources
Other Literature Sources
