. 2007 Mar 13;104(11):4489-94.
doi: 10.1073/pnas.0611557104. Epub 2007 Mar 7.

Global extent of horizontal gene transfer

Affiliations

Global extent of horizontal gene transfer

In-Geol Choi et al. Proc Natl Acad Sci U S A. .

Abstract

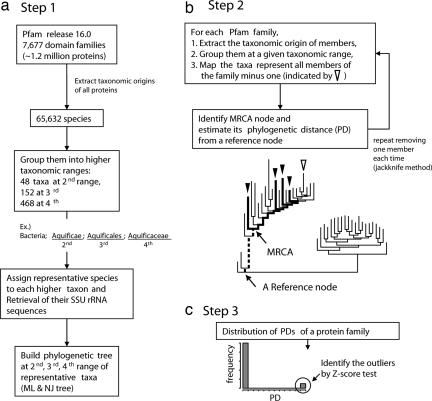
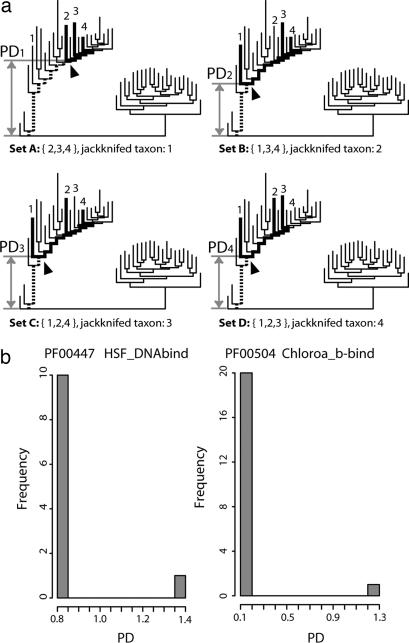
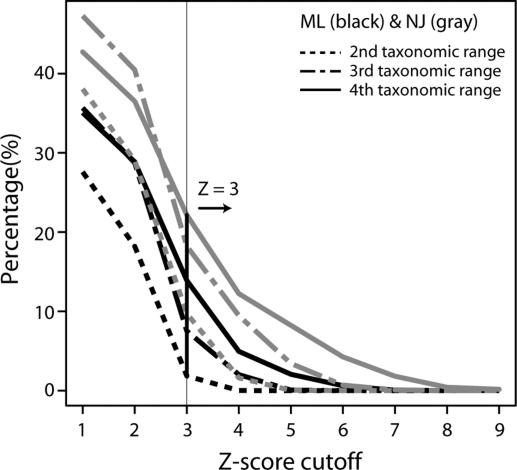
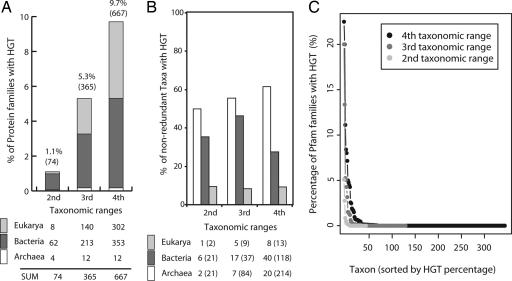
Horizontal gene transfer (HGT) is thought to play an important role in the evolution of species and innovation of genomes. There have been many convincing evidences for HGT for specific genes or gene families, but there has been no estimate of the global extent of HGT. Here, we present a method of identifying HGT events within a given protein family and estimate the global extent of HGT in all curated protein domain families ( approximately 8,000) listed in the Pfam database. The results suggest four conclusions: (i) for all protein domain families in Pfam, the fixation of genes horizontally transferred is not a rampant phenomenon between organisms with substantial phylogenetic separations (1.1-9.7% of Pfam families surveyed at three taxonomic ranges studied show indication of HGT); (ii) however, at the level of domains, >50% of Archaea have one or more protein domains acquired by HGT, and nearly 30-50% of Bacteria did the same when examined at three taxonomic ranges. But, the equivalent value for Eukarya is <10%; (iii) HGT will have very little impact in the construction of organism phylogeny, when the construction methods use whole genomes, large numbers of common genes, or SSU rRNAs; and (iv) there appears to be no strong preference of HGT for protein families of particular cellular or molecular functions.


Conflict of interest statement

The authors declare no conflict of interest.

Figures

Fig. 1.
Fig. 1.
Flow diagram for the detection of HGT in a protein domain family divided into three steps. (a) Step 1: Building the phylogenetic tree of representative taxa covering taxonomic origins of organisms for all protein members in the Pfam (see Materials and Methods for details). (b) Step 2: Mapping all organisms (minus one) represented by the members of a given Pfam family onto the tree, identifying the MRCA node, and estimating its PD from a reference node. This process is repeated each time, removing different organism (jackknife operation). We define the CAG as the gene from which all genes coding for the member proteins of a subset of a protein domain family are derived and assume that the CAG resided in the organism at MRCA node. The PD of the MRCA is defined by the branch length (dashed line) between MRCA node and the reference node. (c) Step 3: Calculate the variance of the values of PDs obtained from the jackknife method and test the presence or absence of outliers from monomodal distribution (by Z-score test) of the PDs. The protein families with outliers are considered as the candidate families containing the members (outliers) that have undergone HGT.
Fig. 2.
Fig. 2.
The 6,883 protein families used in this study are sorted by the family size, i.e., number of members, and listed in decreasing order (horizontal axis). On the vertical axis, the counts of various quantities in a given family are shown: number of family members (a), number of nonredundant species (b), number of representative taxa at fourth taxonomic range (c), at third taxonomic range (d), and at second taxonomic range (e) in the Pfam (release 16) (25). The Spearman's rank-correlation coefficients vary from 0.81 [between number of members (a) and representative taxa at second taxonomic range (e)] to 0.90 [between number of members (a) and nonredundant species (b)].
Fig. 3.
Fig. 3.
Detection of HGT candidates. (a) A simplified hypothetical example of a jackknife operation: If all members of a given protein family belong to four taxa (marked 1–4), the PDs (the dashed lines and scaled gray arrow bars) of MRCAs containing CAGs (indicated by arrowheads) can be calculated from four different subsets, in which one taxon of four was jackknifed out at a time. In this example, set A shows an aberrant PD from others: PD1 is much longer than the remaining three PDs, which have the same short branch length. Thus, we regard this family as a candidate family with HGT. (b) Actual examples for two Pfam families: The histograms showing the number of MRCAs (frequency) vs. PD values obtained from jackknife operation. Both examples show a bimodal distribution, which suggest that both families experienced HGT events. The histogram on the right presents a wider variation in PD distribution. Both clearly show the significant outliers (Z scores ≥3) due to HGT.
Fig. 4.
Fig. 4.
The percentage of protein families with HGT according to various Z-score cutoffs and tree topology. The percentages are presented at various taxonomic ranges by dashed (second level), dot-dashed (third level), or solid (fourth level) lines by using ML (black) or NJ (gray) trees. We set the common inflection point of the plot at Z = 3, which was used as a criterion for identifying outliers from monomodal distribution of PDs.
Fig. 5.
Fig. 5.
Occurrence of HGT at various taxonomic ranges and the distribution in three domains of life. (a) The percentage of protein families that acquired at least one member by HGT event at each taxonomic range. The numbers in parentheses indicate the numbers of protein families (of 6,883 families), of which at least one member joined the family by HGT. The distribution of them in three domains of life was obtained by counting of the target taxa of HGT. (b) The percentage of organisms that acquired at least one protein domain gene by HGT in three domains of life. After removing redundant taxonomic origins from the distribution shown in a, the relative percentages of nonredundant organisms that were the targets of HGT in each domain of life were shown at different taxonomic ranges. The number of nonredundant taxa identified as outliers is shown under the plot, and the numbers in parentheses indicate the number of representative nonredundant taxa examined at different taxonomic ranges. Sampling for Archaea is too small to be reliable, especially at the second taxonomic range. (c) The distribution of the percentages of Pfam families with HGT in taxa at three taxonomic ranges. The percentage of each taxon at a given taxonomic range is indicated by light gray (second taxonomic range), dark gray (third taxonomic range), and black (fourth taxonomic range) circles and lines. There are two extreme outliers with ≥15% HGT that belong to Bacteria (Bacteria Actinobacteria Rubrobacteridae) and Eukarya (Eukarya Fungi Microsporidia Unikaryonidae) and might be a bias due to small sample size.

Similar articles

Cited by

  • The Astrobiology Primer v2.0.
    Domagal-Goldman SD, Wright KE, Adamala K, Arina de la Rubia L, Bond J, Dartnell LR, Goldman AD, Lynch K, Naud ME, Paulino-Lima IG, Singer K, Walther-Antonio M, Abrevaya XC, Anderson R, Arney G, Atri D, Azúa-Bustos A, Bowman JS, Brazelton WJ, Brennecka GA, Carns R, Chopra A, Colangelo-Lillis J, Crockett CJ, DeMarines J, Frank EA, Frantz C, de la Fuente E, Galante D, Glass J, Gleeson D, Glein CR, Goldblatt C, Horak R, Horodyskyj L, Kaçar B, Kereszturi A, Knowles E, Mayeur P, McGlynn S, Miguel Y, Montgomery M, Neish C, Noack L, Rugheimer S, Stüeken EE, Tamez-Hidalgo P, Imari Walker S, Wong T. Domagal-Goldman SD, et al. Astrobiology. 2016 Aug;16(8):561-653. doi: 10.1089/ast.2015.1460. Astrobiology. 2016. PMID: 27532777 Free PMC article. Review. No abstract available.
  • Phylogenomic analysis identifies gene gains that define Salmonella enterica subspecies I.
    Lienau EK, Blazar JM, Wang C, Brown EW, Stones R, Musser S, Allard MW. Lienau EK, et al. PLoS One. 2013 Oct 28;8(10):e76821. doi: 10.1371/journal.pone.0076821. eCollection 2013. PLoS One. 2013. PMID: 24204679 Free PMC article.
  • Activation of SsoPK4, an Archaeal eIF2α Kinase Homolog, by Oxidized CoA.
    Ray WK, Potters MB, Haile JD, Kennelly PJ. Ray WK, et al. Proteomes. 2015 May 15;3(2):89-116. doi: 10.3390/proteomes3020089. Proteomes. 2015. PMID: 28248264 Free PMC article.
  • Predicting plasmid promiscuity based on genomic signature.
    Suzuki H, Yano H, Brown CJ, Top EM. Suzuki H, et al. J Bacteriol. 2010 Nov;192(22):6045-55. doi: 10.1128/JB.00277-10. Epub 2010 Sep 17. J Bacteriol. 2010. PMID: 20851899 Free PMC article.
  • Benefits of using molecular structure and abundance in phylogenomic analysis.
    Caetano-Anollés G, Nasir A. Caetano-Anollés G, et al. Front Genet. 2012 Sep 6;3:172. doi: 10.3389/fgene.2012.00172. eCollection 2012. Front Genet. 2012. PMID: 22973296 Free PMC article. No abstract available.

References

    1. Syvanen M. Annu Rev Genet. 1994;28:237–261. - PubMed
    1. Pennisi E. Science. 1998;280:672–674. - PubMed
    1. Doolittle WF. Science. 1999;284:2124–2128. - PubMed
    1. Jain R, Rivera MC, Lake JA. Proc Natl Acad Sci USA. 1999;96:3801–3806. - PMC - PubMed
    1. Ochman H, Lawrence JG, Groisman EA. Nature. 2000;405:299–304. - PubMed

Publication types

LinkOut - more resources