. 2007 Mar 7;27(10):2617-27.
doi: 10.1523/JNEUROSCI.5308-06.2007.

Slack and Slick K(Na) channels regulate the accuracy of timing of auditory neurons

Affiliations

Slack and Slick K(Na) channels regulate the accuracy of timing of auditory neurons

Bo Yang et al. J Neurosci. .

Abstract

The Slack (sequence like a calcium-activated K channel) and Slick (sequence like an intermediate conductance K channel) genes, which encode sodium-activated K+ (K(Na)) channels, are expressed at high levels in neurons of the medial nucleus of the trapezoid body (MNTB) in the auditory brainstem. These neurons lock their action potentials to incoming stimuli with a high degree of temporal precision. Channels with unitary properties similar to those of Slack and/or Slick channels, which are gated by [Na+]i and [Cl-]i and by changes in cytoplasmic ATP levels, are present in MNTB neurons. Manipulations of the level of K(Na) current in MNTB neurons, either by increasing levels of internal Na+ or by exposure to a pharmacological activator of Slack channels, significantly enhance the accuracy of timing of action potentials at high frequencies of stimulation. These findings suggest that such fidelity of timing at high frequencies may be attributed in part to high-conductance K(Na) channels.


Figures
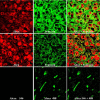
Figure 1.
Figure 1.
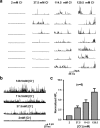
Slack and Slick subunits and KNa channels are present in both the principal cells and the calyces of Held of the MNTB. Red signals show immunofluorescence for Slack (top row, left) and Slick (middle row, left) (detected with Alexa Fluor 546). Syntaxin immunofluorescence in the middle column is shown in green (detected with Alexa Fluor 488). Overlap of syntaxin with Slick or Slack immunoreactivity is shown in the right column. The bottom row shows a negative control with only the secondary antibodies.
Figure 2.
Figure 2.
Traces of KNa channel activity in patches excised from an MNTB neuron. a, Recordings were acquired with voltage steps to −20, 0, +20, and +40 mV from a holding potential of −60 mV (with 130 mm [K+]i/2.5 mm [K+]o, 10 mm [Na+]i, 34.5 mm [Cl]i). b, Amplitude histogram of large-conductance channel activity evoked by a step from −60 to 0 mV with 130 mm [K+]i/2.5 mm [K+]o, 10 mm [Na+]i, 34.5 mm [Cl]i. The inset shows current recording for this histogram. O, Open; C, closed. c, Mean current–voltage (I–V) relationships of channels obtained by determining current amplitude at different voltages using histograms as in b (n = 6). The slope of the line fitted on this I–V plot gives a value of 122 pS.
Figure 3.
Figure 3.
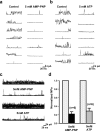
Gating of MNTB channels by [Na+]i. a, Representative traces of channel activity in inside-out patches excised from principal neurons of the MNTB into a medium containing no Na+ or containing 40, 60, or 154.5 mm [Na+]i at the cytoplasmic face of the patch (with 130 mm [K+]i/2.5 mm [K+]o, 34.5 mm [Cl]i). The membrane potential was stepped to 0 mV from a holding potential of −60 mV. b, Na+ dependence of channel gating demonstrated by superimposing 20 channel recordings from inside-out patches with [Na+]i = 154.5, 80, 60, 40, 20, and 0 mm (with 130 mm [K+]i/2.5 mm [K+]o, 34.5 mm [Cl]i). c, Reversibility of the actions of [Na+]i. Records shown represent 20 superimposed channel traces from the same patch as in b. After exposure of the patch to 154.5 mm [Na+]i (top traces), [Na+]i was lowered to 60 mm (middle traces) and returned to 154.5 mm (bottom traces). d, Normalized NPo values determined for different concentrations of Na+ on the intracellular face of the membrane.
Figure 4.
Figure 4.
Dependence of MNTB KNa currents on internal chloride concentration. a, Representative traces of channel activity in inside-out patches excised from principal neurons of the MNTB in medium containing 2.0, 37.5, 114.5, or 129.5 mm Cl (with 130 mm [K+]i/2.5 mm [K+]o, 20 mm [Na+]i). As in Figure 3, the membrane potential was stepped to 0 mV from a holding potential of −60 mV. b, Twenty superimposed sweeps of channel recordings from inside-out patches placed into solutions containing 2.0, 37.5, 114.5, or 129.5 mm Cl. c, Normalized NPo values determined for different concentrations of Cl on the intracellular face of the membrane.
Figure 5.
Figure 5.
Inhibition of MNTB KNa channels by intracellular ATP. a, Representative traces of channel activity excised from the principal neurons of the MNTB before and after application of the nonhydrolysable ATP analog AMP-PNP (5 mm) to the cytoplasmic face of the patch. The membrane potential was stepped to 0 mV from a holding potential of −60 mV. Ion concentrations were 130 mm [K+]i/2.5 mm [K+]o, 20 mm [Na+]i, and 34.5 mm [Cl]i. b, Traces of channel activity from MNTB neurons before and after application of ATP (5 mm; Mg salt) to the cytoplasmic face of the patch. Voltage and ionic conditions are as in a. c, Sixty superimposed sweeps of channel activity before and after application of AMP-PNP or ATP. d, Normalized NPo values for channel activity recorded before and after application of AMP-PNP or 5 mm ATP to the intracellular face of the patches.
Figure 6.
Figure 6.
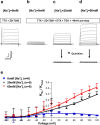
Macroscopic MNTB KNa currents are activated by [Na+]i. a, Whole-cell KNa currents recorded from a principal neuron of the MNTB in the presence of 1 μm TTX and 20 μm ZD-7288 to block Na+ and Ih currents and with no Na+ in the intracellular patch solution. Steps were given from a holding potential of −70 mV to test potentials between −120 and +120 mV in 20 mV increments. b–d, Whole-cell KNa currents recorded from the principal neurons of the MNTB using the same voltage protocol as in a in the presence of 1 μm TTX, 20 μm ZD-7288, together with 100 nm dendrotoxin (DTX) and 1 mm TEA in the ACSF to block Kv1 family and Kv3 family of potassium currents known to be present in these neurons. A 600 ms prepulse to −40 mV before voltage steps to test potentials was also applied to eliminate a small and rapidly inactivating component of K+ current. Traces in b–d were recorded with patch pipettes containing 0, 20, and 60 mm Na+, respectively. The bottom panels of c and d show that bath application of 1 mm quinidine eliminated these native KNa currents. e, Summary data showing the amplitude of the macroscopic KNa currents with 0, 20, and 60 mm Na+ in the recording pipettes.
Figure 7.
Figure 7.
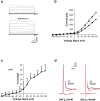
Bithionol enhances native KNa currents and the AHPs of MNTB neurons. a, Representative whole-cell KNa current recordings from a principal neuron of the MNTB with ACSF containing 1 μm TTX, 100 nm dendrotoxin, 1 mm TEA, and 20 μm ZD-7288 and a 600 ms prestep of −40 mV with 20 mm [Na+]i before and after bath application of 10 μm bithionol. b, I–V curves of whole-cell KNa currents in MNTB neurons before (filled squares) and after (open squares) 10 μm bithionol. c, Summary data showing percentage of change of native KNa currents in MNTB neurons at different voltages after exposure to 10 μm bithionol. d, Bithionol enhances the AHP that follows MNTB neuron action potentials evoked by a single depolarizing current pulse. Superimposed traces show action potentials before (black) and after (red) 10 μm bithionol. The insets show AHPs at higher magnification.
Figure 8.
Figure 8.
Response to MNTB neurons to increasing rates of stimulation. Action potential responses of an MNTB neuron recorded with a patch pipette containing 20 mm Na+. The neuron was stimulated with a train of depolarizing current pulses applied at frequencies from 50 to 300 Hz. At stimulus frequencies up to 170 Hz, action potentials were evoked by every stimulus pulse (left traces). At 180–230 Hz, the timing of evoked action potentials became scattered with respect to the stimulus pulses (middle traces). When the stimulus frequency was increased past 240 Hz, this cell responded to high-frequency stimulation with a lower frequency of firing that remains locked to individual stimuli (right traces).
Figure 9.
Figure 9.
KNa channels regulate the accuracy of timing of MNTB neurons. a, Plot of phase vector strength as a function of stimulus frequency for the cell shown in Figure 8. b, Summary of phase vector-strength experiments with 0, 5, 20, or 40 mm [Na+]i. c, A plot of phase vector strength as a function of stimulus frequency for numerical simulations of a model MNTB neuron with a KNa current with properties intermediate between those of Slack and Slick and with 20 mm [Na+]i. d, Superimposed plots of phase vector strength as a function of stimulus frequency for the model neuron with 0, 5, and 40 mm [Na+]i. The vector strength declines with increasing frequency for all levels of intracellular Na+, but the dips in vector strength that occur when stimuli fail to evoke action potentials at a regular frequency are substantially reduced with increasing [Na+]i. e, Plot of phase vector strength as a function of stimulus frequency for a real MNTB neuron with 20 mm [Na+]i before and after perfusion of 10 μm bithionol onto the slice and after washout of bithionol. f, Summary of phase vector strength experiments in cells before and after perfusion with 10 μm bithionol.

Similar articles

Cited by

References

    1. Banks M, Smith PH. Intracellular recordings from neurobiotin-labeled cells in brain slices of the rat medial nucleus of the trapezoid body. J Neurosci. 1992;12:2819–2837. - PMC - PubMed
    1. Barnes-Davies M, Forsythe ID. Pre- and postsynaptic glutamate receptors at a giant excitatory synapse in rat auditory brainstem slices. J Physiol (Lond) 1995;488:387–406. - PMC - PubMed
    1. Barr FS, Collins GF, Wyatt LG. Potentiation of the antimicrobial activity of bithionol. J Pharm Sci. 1965;54:801–802. - PubMed
    1. Bhattacharjee A, Gan L, Kaczmarek LK. Localization of the Slack potassium channel in the rat central nervous system. J Comp Neurol. 2002;454:241–254. - PubMed
    1. Bhattacharjee A, Joiner WJ, Wu M, Yang Y, Sigworth FJ, Kaczmarek LK. Slick (Slo2.1), a rapidly-gating sodium-activated potassium channel inhibited by ATP. J Neurosci. 2003;23:11681–11691. - PMC - PubMed

Publication types

MeSH terms