Comparative Study
. 2007 Jun 15;109(12):5346-54.
doi: 10.1182/blood-2006-10-051318. Epub 2007 Feb 27.

CD4 cells can be more efficient at tumor rejection than CD8 cells

Affiliations
Comparative Study

CD4 cells can be more efficient at tumor rejection than CD8 cells

Ainhoa Perez-Diez et al. Blood. .

Abstract

Researchers designing antitumor treatments have long focused on eliciting tumor-specific CD8 cytotoxic T lymphocytes (CTL) because of their potent killing activity and their ability to reject transplanted organs. The resulting treatments, however, have generally been surprisingly poor at inducing complete tumor rejection, both in experimental models and in the clinic. Although a few scattered studies suggested that CD4 T "helper" cells might also serve as antitumor effectors, they have generally been studied mostly for their ability to enhance the activity of CTL. In this mouse study, we compared monoclonal populations of tumor-specific CD4 and CD8 T cells as effectors against several different tumors, and found that CD4 T cells eliminated tumors that were resistant to CD8-mediated rejection, even in cases where the tumors expressed major histocompatibility complex (MHC) class I molecules but not MHC class II. MHC class II expression on host tissues was critical, suggesting that the CD4 T cells act indirectly. Indeed, the CD4 T cells partnered with NK cells to obtain the maximal antitumor effect. These findings suggest that CD4 T cells can be powerful antitumor effector cells that can, in some cases, outperform CD8 T cells, which are the current "gold standard" effector cell in tumor immunotherapy.


Figures

Figure 1
Figure 1
In vitro characterization of the MataHari and Marilyn T cells and the MB49 tumor. (A) TCR, CD8, and CD4 expression of MataHari (Vβ8) and Marilyn (Vβ6) T cells. Numbers represent the percentage of transgenic cells in the mixed population of spleen and mesenteric lymph node cells used in the adoptive transfer experiments. (B) H-Y expression of the MB49 tumor. PCR using specific primers for the sequences of Dby and Uty that code for the peptide epitopes seen by Marilyn and MataHari, respectively. Spleens from female and male B6 mice were used as negative and positive controls. (C) Expression of MHC Class I (Db) and MHC Class II (Ab) by in vitro-grown MB49 tumor cells that were either untreated (−) or incubated for 2 days with 500 IU/mL of IFN-γ (+IFN-γ) or by tumor cells growing subcutaneously in a female B6 mouse, 7 days after inoculation (ex vivo). Unshaded area is staining seen with a control antibody (specific for Kd.) (D) In vitro antitumor activity. Eighteen-hour JAM test to measure killing activity of MataHari cells (left panel) or Marilyn cells (right panel) against MB49 (circles) or B16 (squares) tumor targets that had been incubated with IFN-γ as in C (filled symbols) or not (open symbols). R/T = responder to target ratio. (E) Proliferation of Marilyn CD4 cells in vitro. Proliferation of Marilyn cells either alone (asterisk) or in presence of mitomycin treated MB49 (circles), B16 (squares), male spleen (diamonds), or female spleen (triangles) as described in “Materials and methods.” The highest number of stimulators were 1.5 × 10⁴ for the tumor cells and 5 × 10⁵ for the splenocytes. D and E show one experiment that is representative of 3.
Figure 2
Figure 2
Marilyn CD4 cells reject MB49 tumor in vivo better than MataHari CD8 cells. (A) Survival of RAG.KO mice (dashed line), MataHari mice (circles) or Marilyn mice (triangles) after challenge with MB49 tumor cells. (B) Survival of RAG.KO mice that were infused one day after tumor challenge with 106 MataHari cells (circles) or 105 Marilyn cells (triangles) or no cells (dashed line).
Figure 3
Figure 3
Both helpless and helped MataHari CD8 cells are effective killers but cannot reject the MB49 tumor. (A) Concanavalin A supernatant (CAS), as a source of helper factors, improves killing activity of MataHari. MataHari cells were cultured without (open circles) or with (filled circles) CAS and then tested in vitro (one representative experiment out of 3) against MB49 or B16 tumor targets (solid or dashed lines, respectively) in a 4-hour P-JAM Test (“Materials and methods”). (B) In vivo activity of “helped” MataHari cells. MataHari cells were stimulated in vitro in the presence of CAS and then adoptively transferred into RAG.KO recipients that had been challenged with MB49 tumor cells one day previously. Data are from 2 pooled experiments, of which one is the same experiment as shown in A. (C) Presence of the MB49 tumor does not inhibit the in vivo killing activity of MataHari. In vivo killing activity was measured, at day 20 or 28, in tumor-bearing RAG.KO recipient mice (closed symbols) and in non—tumor-bearing controls (open symbols) that had been infused with either CAS-MataHari cells or naive Marilyn cells at day 1 after tumor challenge. To assess the male-specific killing activity, equal numbers of CFSE-labeled male and female target splenocytes were given, and the remaining target cells in SPL (squares), inguinal and axillary TDLN (triangles) and non—tumor-draining contralateral LN (circles) analyzed 18 to 24 hours later. Data are pooled from 2 independent experiments. (D and E) Analysis of MHC expression and MataHari trafficking in the tumor. MB49 tumors were collected 20 days after challenge, from untreated or CAS-MataHari treated RAG.KO (as in A) and analyzed by FACS, gating on 7-AAD cells. (D) Presence of MataHari. Number represents the percentage of CD8 cells, found at the tumor site in one representative mouse. (E) Class I (Db) staining of tumor cells (gating on CD45.2 cells). Data in D and E are each from 2 mice representative of 10 analyzed. (F) Tumors growing in the presence of MataHari cells are not escape variants. Large tumors growing in RAG.KO mice (420 mm3), or in RAG.KO into which MataHari CD8 cells had been transferred (500 mm3), were excised when required by Animal Care and Use Committee protocols (19 days after adoptive transfer of the CD8 cells). Tumors were labeled with [3H]thymidine overnight and used as targets for previously in vitro activated MataHari cells in a 24-hour JAM Test. (G) Presence of anti-H-Y CD8 cells in normal B6 mice. Db/Uty tetramer staining in blood of a naive female B6 mouse (left panel) and of a moribund tumor-bearing female B6 mouse (right panel). Numbers represent the percentage of CD8 cells that bind to the tetramers. Two mice representative of 16.
Figure 4
Figure 4
Role of MHC Class II on tumor cells. (A) shRNA-mediated down-regulation of MHC class II expression by MB49. Three RAG.KO mice per group were challenged (day 0) with each of the tumor cell lines, MB49mock, MB49-LacZ(i), and MB49-Ab(i). On day 5, they received 8 × 10⁵ Marilyn cells to induce the up-regulation of class II molecules and on day 13 the tumors were taken for analysis (gating on the CD45.2 and 7-AAD population to exclude immigrating immune cells and dead cells). Histograms represent class II (Ab) staining of the tumor cells from one mouse from each group. Empty line is the isotype control. Bar graph represents the averages of the mean fluorescence of the 3 mice per group (gray area) compared with that of the isotype controls (white). (B) Marilyn cells reject tumors with knocked-down Ab: RAG.KO mice were challenged with either 105 MB49 mock cells (no symbol), or MB49-∅ (circles), MB49-LacZ(i) (squares), or MB49-Ab(i) (diamonds) cells. One day later, half of the mice in each group received 106 Marilyn cells (closed symbols). The average tumor size (10-20 mice total per group), from 3 individual experiments is shown. (C) Marilyn mice reject tumors that do not express Ab. Percentage of tumor free RAG.KO (broken line), MataHari (circles), or Marilyn (triangles) mice after challenge with 5 × 10⁶ βTC-tet (H-2k) pancreatic tumor cells. Data were pooled from 2 experiments.
Figure 5
Figure 5
H-Y antigen is cross-presented in vivo to both MataHari and Marilyn T cells. CFSE dilution of MataHari (A) or Marilyn (B) T cells 4 days after transfer into either H-2bRAG.KO tumor free (top panels) or H-2k-tumor bearing (bottom panels) mice. Histograms are gated on TCRαβ and CD8 or CD4, for MataHari or Marilyn, respectively. Cells are from the inguinal and axillary lymph nodes (the tumor-draining lymph nodes in the tumor-bearing mice). Numbers represent the percentage of TCR transgenic cells that divided more than 6 times.
Figure 6
Figure 6
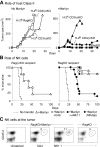
Role of host MHC class II, and of host NK cells, in CD4-mediated tumor rejection. (A) Role of host MHC class II. RAG.KO (H-2b) mice (squares) and CD3KO/γcKO H-2b (circles) or H-2k (triangles) mice were challenged with MB49 cells. Approximately half of the mice per group were either untreated (left panel) or received 106 Marilyn cells 1 day later (right panel). To overcome the need for class II (Ab) for initiating and maintaining CD4 T-cell activation, mice receiving Marilyn cells were immunized with male splenocytes at days 2, 5, 7, 9, 13, and 17 after tumor challenge. The average tumor size (6-12 mice per group) from a total of 3 individual experiments is shown. (B) Role of NK cells. Percentage of RAG.KO/γcKO recipient mice (left panel) or RAG.KO mice (right panel) alive after receiving MB49 challenge and left untreated (broken line) or treated with 106 Marilyn cells (triangles). Some of the RAG.KO mice received Marilyn cells that had been depleted of NK cells (to deplete donor NK cells only [closed diamonds]), Marilyn cells plus either anti-NK monoclonal antibodies (to deplete both host and donor NK cells [closed circles]), or control antibodies (open circles) as described in “Materials and methods.” Data pooled from 3 independent experiments. (C) NK cells are present in the tumor. MB49 tumors were collected from Marilyn-treated RAG.KO mice 49 days after challenge and analyzed for the presence of various cell populations by FACS, gating on living 7-AAD cells. Numbers represent the percentage of CD4 or NK cells within the CD45 population found at the tumor site. For comparison, tumors growing in untreated RAG.KO mice were stained for NK in the same way cells, 28 days after tumor challenge. Data are representative of 1 of 2 mice.
Figure 7
Figure 7
CD4 antitumor effect is generalizable. (A) Rachel, another anti-H-Y CD4 TCR Tg mouse, also rejects MB49. Percentage of RAG.KO mice alive after being challenged with MB49 tumor cells and receiving, 1 day later, either nothing (broken lines), 106 Marilyn cells (triangles), or 106 Rachel cells (an anti-H-Y CD4 transgenic mouse with a different TCR from that of Marilyn). Data from 3 pooled experiments. (B and C) Marilyn's superiority to MataHari is seen with other tumors: percentage of RAG.KO (broken line), MataHari (circles), or Marilyn (triangles) mice that survived challenge with either (B) H-2b carcinomas: 3 × 10⁵ of WR21 (left panel, a salivary gland carcinoma), 3 × 10⁶ of TRAMP-C2 (right panel, prostate carcinoma), or (C) H-2k endotheliomas: IP2-E4 (left panel), 3B-11 (middle panel), or H-Y–negative 2F-2B (right panel), 2 × 10⁵ of each.

Similar articles

Cited by

References

    1. Lee KH, Wang E, Nielsen MB, et al. Increased vaccine-specific T cell frequency after peptide-based vaccination correlates with increased susceptibility to in vitro stimulation but does not lead to tumor regression. J Immunol. 1999;163:6292–6300. - PubMed
    1. Dudley ME, Wunderlich JR, Robbins PF, et al. Cancer regression and autoimmunity in patients after clonal repopulation with antitumor lymphocytes. Science. 2002;298:850–854. - PMC - PubMed
    1. Dudley ME, Wunderlich JR, Yang JC, et al. A phase I study of nonmyeloablative chemotherapy and adoptive transfer of autologous tumor antigen-specific T lymphocytes in patients with metastatic melanoma. J Immunother. 2002;25:243–251. - PMC - PubMed
    1. Peterson AC, Harlin H, Gajewski TF. Immunization with Melan-A peptide-pulsed peripheral blood mononuclear cells plus recombinant human interleukin-12 induces clinical activity and T-cell responses in advanced melanoma. J Clin Oncol. 2003;21:2342–2348. - PubMed
    1. Boon T, Coulie PG, Eynde BJ, Bruggen PV. Human T cell responses against melanoma. Annu Rev Immunol. 2006;24:175–208. - PubMed

Publication types

MeSH terms

Substances