. 2007 Feb 26;176(5):695-707.
doi: 10.1083/jcb.200612129.

Notch signaling is necessary for epithelial growth arrest by TGF-beta

Affiliations

Notch signaling is necessary for epithelial growth arrest by TGF-beta

Hideki Niimi et al. J Cell Biol. .

Abstract

Transforming growth factor beta (TGF-beta) and Notch act as tumor suppressors by inhibiting epithelial cell proliferation. TGF-beta additionally promotes tumor invasiveness and metastasis, whereas Notch supports oncogenic growth. We demonstrate that TGF-beta and ectopic Notch1 receptor cooperatively arrest epithelial growth, whereas endogenous Notch signaling was found to be required for TGF-beta to elicit cytostasis. Transcriptomic analysis after blocking endogenous Notch signaling uncovered several genes, including Notch pathway components and cell cycle and apoptosis factors, whose regulation by TGF-beta requires an active Notch pathway. A prominent gene coregulated by the two pathways is the cell cycle inhibitor p21. Both transcriptional induction of the Notch ligand Jagged1 by TGF-beta and endogenous levels of the Notch effector CSL contribute to p21 induction and epithelial cytostasis. Cooperative inhibition of cell proliferation by TGF-beta and Notch is lost in human mammary cells in which the p21 gene has been knocked out. We establish an intimate involvement of Notch signaling in the epithelial cytostatic response to TGF-beta.


Figures
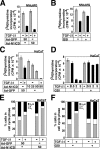
Figure 1.
Figure 1.
Notch and TGF-β cooperate during epithelial growth arrest. (A–D) Thymidine incorporation assays in NMuMG (A and B) or HaCaT (C and D) cells infected with Ad-GFP or Ad-N1ICD (multiplicity of infection [MOI] of 50) and stimulated with vehicle (−) or 2 ng/ml TGF-β1 for 60 h (A and C) or stimulated with TGF-β1 in the presence or absence of 4 μM GSI (B and D). In D, 0.5–5 ng/ml TGF-β1 was used. (E and F) HaCaT cell cycle analysis under conditions as in C and D. The percentage of cells per cell cycle phase is plotted in bar graphs. Error bars represent SD.
Figure 2.
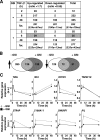
Figure 2.
Transcriptomic analysis of the dependence of TGF-β1 on Notch signaling. (A and B) Cumulative gene expression data from HaCaT cells (A) and Venn diagrams (B) that cluster genes to each category of cell treatment. The total (Tot) gene numbers indicate the number of annotated (a) and nonannotated (na) genes. Gray table cells indicate significant deviations (P < 0.01) upon GSI treatment relative to the control. In B, up- and down-regulated (arrows) gene numbers are shown within each Venn diagram. (C) Kinetic graphs of eight representative genes with expression values (arbitrary units [au]) calculated from the microarray data. Error bars represent SD.
Figure 3.
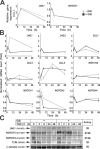
Figure 3.
TGF-β1 regulates the expression of Notch ligands and receptors. (A) Kinetic expression profiles of JAG1 and NOTCH1 measured via microarray analysis (expressed in arbitrary units [au]). (B) Quantitative RT-PCR of JAG1,2, DLL1,2,3, and NOTCH1,2,3,4 mRNAs in HaCaT cells stimulated with 2 ng/ml TGF-β1 for 2, 6, 24, and 48 h in the absence (DMSO, −; gray lines) or presence of 4 μM GSI (+; black lines). Relative gene expression values (fold change) after normalization to GAPDH gene expression are shown. (C) Immunoblot analysis of JAG1, NOTCH1, NOTCH3, TβRI, and control β-tubulin protein levels from HaCaT cells treated with TGF-β1 and GSI as indicated. Immunoblots of total cell lysates (IB) or immunoblots after immunoprecipitation (IP/IB) are shown. Error bars represent SD.
Figure 4.
Figure 4.
TGF-β target genes of the cytostatic and apoptotic program and their dependence on Notch signaling. (A) Table listing 11 regulated genes with links to cell cycle and apoptosis and statistically significant (black; P < 0.05) or nonsignificant (gray; P > 0.05) expression values. Gray cells indicate genes for which GSI treatment had a clear impact. (B) Quantitative RT-PCR of c-Myc, CCNB2, GADD45B, CDKN2B, and CDKN1A mRNAs in HaCaT cells treated as in Fig. 3 B. (C) Immunoblot of endogenous p21 and control β-tubulin in HaCaT cells stimulated with 2 ng/ml TGF-β1 for 0–24 h in the absence (−, DMSO) or presence (+) of 4 μM GSI.
Figure 5.
Figure 5.
Jagged1 is a TGF-β target that regulates p21 induction and epithelial cytostasis. (A) Diagram of the signaling pathway established in this paper (black arrows). Gray arrows point to previously established regulatory connections between components of the pathway. Inhibitory connections with compounds and siRNAs at the bottom illustrate the experimental means used during this study. TβR, TGF-β receptor; LY, TGF-β receptor type I inhibitor LY580276; KO, knockout. (B) Quantitative RT-PCR analysis of endogenous JAGGED1 (JAG1) mRNA levels normalized over endogenous GAPDH from HaCaT cells transiently transfected with siLuc (black lines) or siJAG1 (gray lines) and subsequently stimulated with 2 ng/ml TGF-β1 for 0, 2, 6, 12, and 24 h. (C) Immunoblot of endogenous JAG1, phospho-Smad2, phospho-Smad3, total Smad2 and Smad3, and α-tubulin control from HaCaT cells transfected as in B and stimulated with 2 ng/ml TGF-β1 for the indicated time points. (D) Quantitative RT-PCR analysis of endogenous p21 (CDKN1A) mRNA levels normalized over endogenous GAPDH from HaCaT cells transfected and stimulated as in B. (E) Immunoblot of endogenous p21 and β-tubulin control from HaCaT cells transfected as in B and stimulated with 2 ng/ml TGF-β1 for the indicated time points. (F) Thymidine incorporation assay in HaCaT cells transfected as in B and stimulated with vehicle (gray bars) or 2 ng/ml TGF-β1 (black bars) for 60 h. Error bars represent SD.
Figure 6.
Figure 6.
CSL signaling is critical for p21 induction and epithelial growth arrest by TGF-β. (A) Quantitative RT-PCR of CSL mRNA levels in HaCaT cells transfected with control siLuc or specific siCSL siRNAs and stimulated or unstimulated with 2 ng/ml TGF-β1 for 16 h. (B) Immunoblot of endogenous phospho-Smad2, phospho-Smad3, total Smad2 and Smad3, and endogenous control α-tubulin levels from HaCaT cells transiently transfected with siCSL or siLuc before stimulation with 2 ng/ml TGF-β1 for the indicated time points. (C–E) Quantitative RT-PCR analysis of CSL, ectopic Ad-N1ICD, and p21 (CDKN1A) mRNA normalized over GAPDH in HaCaT cells transfected with siLuc or siCSL and subsequently infected with Ad-GFP or Ad-N1ICD (MOI of 50) before stimulation with 2 ng/ml TGF-β1 for 24 h. (F) Immunoblot of endogenous p21 and CSL, ectopic Ad-N1ICD, and endogenous control β-tubulin levels from HaCaT cells transiently transfected with siCSL or siLuc and subsequently infected with Ad-GFP or Ad-N1ICD (MOI of 50) before stimulation with 2 ng/ml TGF-β1 for 24 h. The conditions are identical to those in C–E. (G) Thymidine incorporation assay in HaCaT cells transfected with siRNAs as in C, which were subsequently coinfected with the indicated adenoviruses (MOI of 50) and were stimulated or unstimulated with 2 ng/ml TGF-β1 for 60 h. Error bars represent SD.
Figure 7.
Figure 7.
Role of γ-secretase on the accumulation of phospho-Smad levels. (A) Immunoblot of endogenous phospho-Smad2 and -Smad3 and corresponding total Smad2 and Smad3 levels in HaCaT cells stimulated with 2 ng/ml TGF-β1 for the indicated time points in the presence of DMSO (−) or 4 μM GSI (+). (B) Immunoblot of endogenous phospho-Smad2 and -Smad3 and corresponding total Smad2 and Smad3 levels in HaCaT cells transiently infected with Ad-GFP or Ad-N1ICD (MOI of 50 each) before stimulation with 2 ng/ml TGF-β1 for the indicated time points. (C) Immunoblot of p21, ectopic N1ICD, and control Smad2/Smad3 and β-tubulin from HaCaT cells infected with Ad-GFP (MOI of 50) or Ad-N1ICD (MOI of 10, 25, and 50) before stimulation with 2 ng/ml TGF-β1 for 24 h in the absence (−, DMSO) or presence (+) of 4 μM GSI. Densitometric values of p21 protein bands normalized over β-tubulin are shown between the immunoblots. The 0-h TGF-β1 without GSI condition is normalized to 1.0, and all other values are expressed relatively. In the right panel, the denominator represents the fold decrease in inducible p21 caused by GSI. (D) Thymidine incorporation assays in HaCaT cells infected with Ad-GFP or Ad-N1ICD (MOI of 10, 25, and 50) and stimulated with vehicle (−) or 2 ng/ml TGF-β1 (+) for 60 h in the absence (DMSO) or presence of 4 μM GSI. (E) Thymidine incorporation assay in HaCaT cells stimulated with 2 ng/ml TGF-β1 for 60 h in the absence or presence of 4 μM GSI, which was added after the onset of TGF-β1 stimulation and was present in the cell culture for the indicated time points. The top horizontal line indicates the level of thymidine incorporation that corresponds to 80% of the control level in the presence of GSI (third bar), and the bottom horizontal line corresponds to the level of thymidine incorporation that shows a statistically significant (P < 0.05) difference from the level of thymidine incorporation in the presence of TGF-β1 in the control condition (second bar). All values below this line are not significantly different from this reference point (P < 0.05) except for the last condition, which is significantly lower. (F) Immunoblot of endogenous p21 and α-tubulin control from HaCaT cells stimulated with 2 ng/ml TGF-β1 for 60 h in the absence or presence of 4 μM GSI that was added after TGF-β1 stimulation and stayed in the culture for the indicated time points. The conditions are identical to those in E. Error bars represent SD.
Figure 8.
Figure 8.
The cell cycle inhibitor p21 is required for mammary epithelial cytostasis by TGF-β and Notch. (A–D) Thymidine incorporation assays in MCF-10A wild-type (WT) cells (A and C) or MCF-10A p21−/− homozygous knockout clone 2 cells (B and D) infected with Ad-GFP or Ad-N1ICD (MOI of 50) and either stimulated with vehicle (−) or 2 ng/ml TGF-β1 for 60 h (A and B) or stimulated with TGF-β1 in the presence or absence of 4 μM GSI (C and D). Immunoblots from the same cells for ectopic N1ICD, endogenous p21, and control endogenous α-tubulin are shown below the bar graphs. Error bars represent SD.

Similar articles

Cited by

References

    1. Akiyoshi, S., M. Ishii, N. Nemoto, M. Kawabata, H. Aburatani, and K. Miyazono. 2001. Targets of transcriptional regulation by transforming growth factor-β: expression profile analysis using oligonucleotide arrays. Jpn. J. Cancer Res. 92:257–268. - PMC - PubMed
    1. Bachman, K.E., B.G. Blair, K. Brenner, A. Bardelli, S. Arena, S. Zhou, J. Hicks, A.M. De Marzo, P. Argani, and B.H. Park. 2004. p21WAF1/CIP1 mediates the growth response to TGF-β in human epithelial cells. Cancer Biol. Ther. 3:221–225. - PubMed
    1. Blokzijl, A., C. Dahlqvist, E. Reissmann, A. Falk, A. Moliner, U. Lendahl, and C.F. Ibanez. 2003. Cross-talk between the Notch and TGF-β signaling pathways mediated by interaction of the Notch intracellular domain with Smad3. J. Cell Biol. 163:723–728. - PMC - PubMed
    1. Brunkan, A.L., and A.M. Goate. 2005. Presenilin function and γ-secretase activity. J. Neurochem. 93:769–792. - PubMed
    1. Chen, C.R., Y. Kang, and J. Massagué. 2001. Defective repression of c-myc in breast cancer cells: a loss at the core of the transforming growth factor β growth arrest program. Proc. Natl. Acad. Sci. USA. 98:992–999. - PMC - PubMed

Publication types

MeSH terms

Substances