

Gene expression profiling reveals defined functions of the ATP-binding cassette transporter COMATOSE late in phase II of germination
- PMID: 17322332
- PMCID: PMC1851828
- DOI: 10.1104/pp.107.096057
Gene expression profiling reveals defined functions of the ATP-binding cassette transporter COMATOSE late in phase II of germination
Abstract
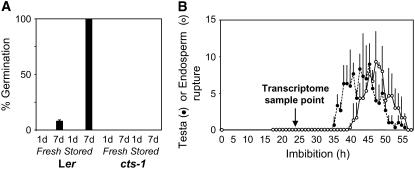
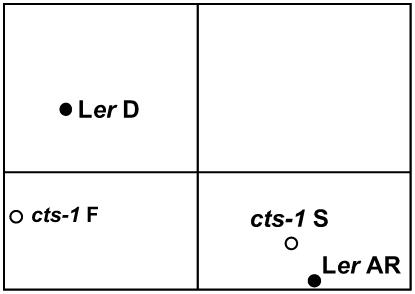
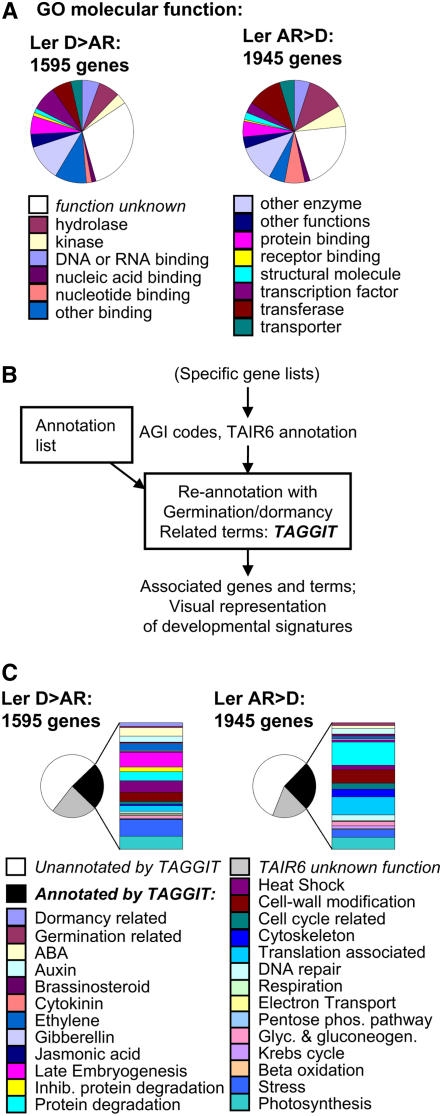
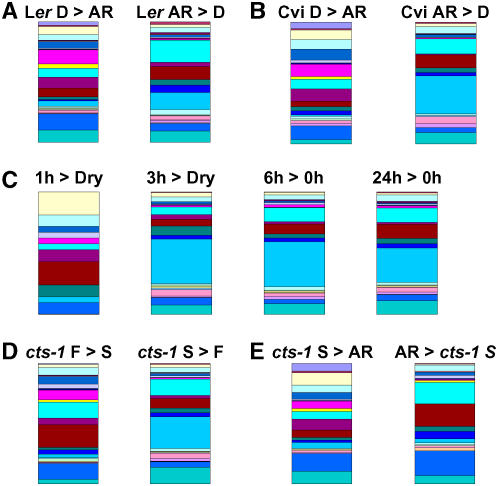
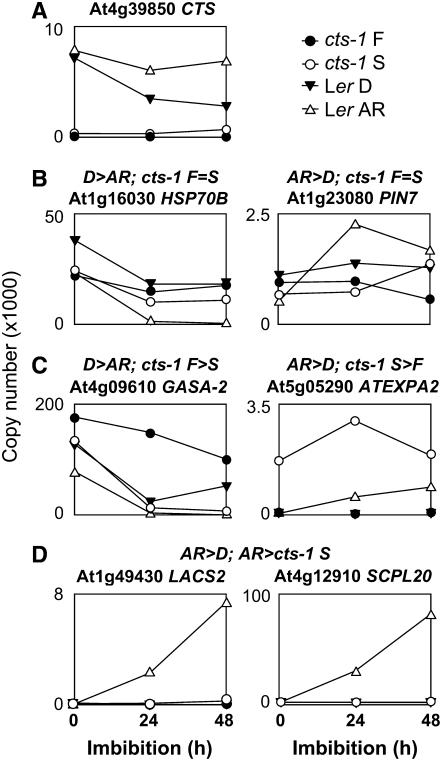
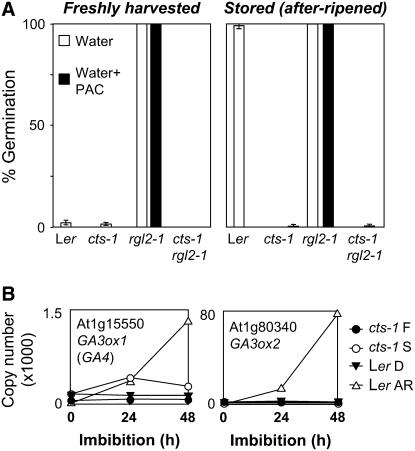
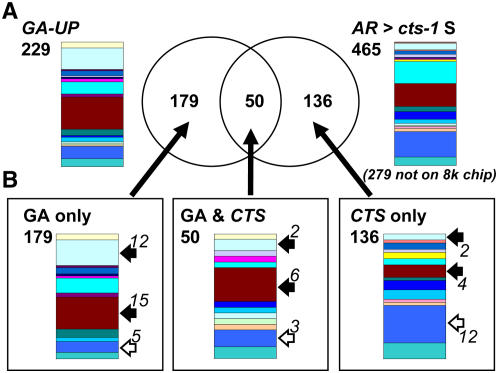
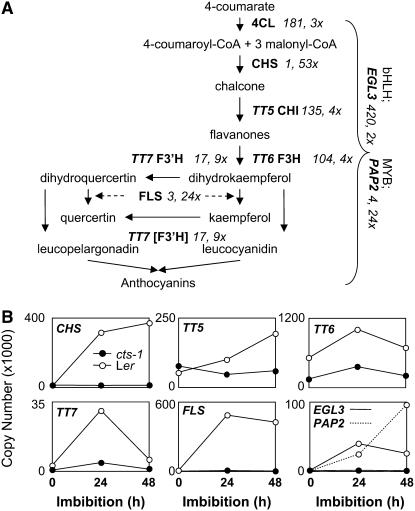
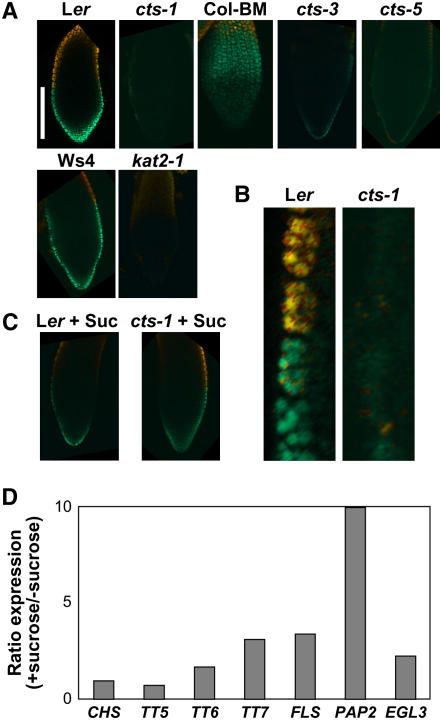
Phase II of germination represents a key developmental stage of plant growth during which imbibed seeds either enter stage III of germination, completing the germination process via radicle protrusion, or remain dormant. In this study, we analyzed the influence of the peroxisomal ATP-binding cassette transporter COMATOSE (CTS) on the postimbibition seed transcriptome of Arabidopsis (Arabidopsis thaliana) and also investigated interactions between gibberellin (GA) and CTS function. A novel method for analysis of transcriptome datasets allowed visualization of developmental signatures of seeds, showing that cts-1 retains the capacity to after ripen, indicating a germination block late in phase II. Expression of the key GA biosynthetic genes GA3ox1 and 2 was greatly reduced in cts seeds and genetic analysis suggested that CTS was epistatic to RGL2, a germination-repressing DELLA protein that is degraded by GA. Comparative analysis of seed transcriptome datasets indicated that specific cohorts of genes were influenced by GA and CTS. CTS function was required for expression of the flavonoid biosynthetic pathway. Confocal imaging demonstrated the exclusive accumulation of flavonoids in the epidermis of wild-type seeds. In contrast, flavonoids were absent from cts and kat2-1 mutant seeds, but accumulated following the application of sucrose, indicating an essential role for beta-oxidation in inducing flavonoid biosynthetic genes. These results demonstrate that CTS functions very late in phase II of germination and that its function is required for the expression of specific gene sets related to an important biochemical pathway associated with seedling establishment and survival.
Figures
Similar articles
-
Analysis of the role of COMATOSE and peroxisomal beta-oxidation in the determination of germination potential in Arabidopsis.J Exp Bot. 2006;57(11):2805-14. doi: 10.1093/jxb/erl045. Epub 2006 Jul 14. J Exp Bot. 2006. PMID: 16844736
-
Control of germination and lipid mobilization by COMATOSE, the Arabidopsis homologue of human ALDP.EMBO J. 2002 Jun 17;21(12):2912-22. doi: 10.1093/emboj/cdf300. EMBO J. 2002. PMID: 12065405 Free PMC article.
-
The COMATOSE ATP-binding cassette transporter is required for full fertility in Arabidopsis.Plant Physiol. 2007 Jul;144(3):1467-80. doi: 10.1104/pp.107.099903. Epub 2007 Apr 27. Plant Physiol. 2007. PMID: 17468211 Free PMC article.
-
A peroxisomal ABC transporter promotes seed germination by inducing pectin degradation under the control of ABI5.Plant J. 2010 Jun 1;62(6):936-47. doi: 10.1111/j.1365-313X.2010.04205.x. Epub 2010 Mar 11. Plant J. 2010. PMID: 20345608
-
Gibberellin mobilizes distinct DELLA-dependent transcriptomes to regulate seed germination and floral development in Arabidopsis.Plant Physiol. 2006 Oct;142(2):509-25. doi: 10.1104/pp.106.082289. Epub 2006 Aug 18. Plant Physiol. 2006. PMID: 16920880 Free PMC article.
Cited by
-
Seed after-ripening is a discrete developmental pathway associated with specific gene networks in Arabidopsis.Plant J. 2008 Jan;53(2):214-24. doi: 10.1111/j.1365-313X.2007.03331.x. Epub 2007 Nov 19. Plant J. 2008. PMID: 18028281 Free PMC article.
-
A seed coat bedding assay shows that RGL2-dependent release of abscisic acid by the endosperm controls embryo growth in Arabidopsis dormant seeds.Proc Natl Acad Sci U S A. 2010 Nov 2;107(44):19108-13. doi: 10.1073/pnas.1012896107. Epub 2010 Oct 18. Proc Natl Acad Sci U S A. 2010. PMID: 20956298 Free PMC article.
-
Seed Dormancy Involves a Transcriptional Program That Supports Early Plastid Functionality during Imbibition.Plants (Basel). 2018 Apr 19;7(2):35. doi: 10.3390/plants7020035. Plants (Basel). 2018. PMID: 29671830 Free PMC article.
-
Transcript profiles uncover temporal and stress-induced changes of metabolic pathways in germinating sugar beet seeds.BMC Plant Biol. 2008 Dec 1;8:122. doi: 10.1186/1471-2229-8-122. BMC Plant Biol. 2008. PMID: 19046420 Free PMC article.
-
Identification of quantitative trait loci associated with germination using chromosome segment substitution lines of rice (Oryza sativa L.).Theor Appl Genet. 2011 Aug;123(3):411-20. doi: 10.1007/s00122-011-1593-9. Epub 2011 Apr 22. Theor Appl Genet. 2011. PMID: 21512773
References
-
- Baudry A, Heim MA, Dubreucq B, Caboche M, Weisshaar B, Lepiniec L (2004) TT2, TT8, and TTG1 synergistically specify the expression of BANYULS and proanthocyanidin biosynthesis in Arabidopsis thaliana. Plant J 39 366–380 - PubMed
-
- Bewley JD, Black M (1994) Seeds; Physiology of Development and Germination. Plenum Press, New York
-
- Cadman CSC, Toorop PE, Hilhorst HWM, Finch-Savage WE (2006) Gene expression profiles of Arabidopsis Cvi seeds during dormancy cycling indicate a common underlying dormancy control mechanism. Plant J 46 805–822 - PubMed
Publication types
MeSH terms
Substances
LinkOut - more resources
Full Text Sources
Molecular Biology Databases
Research Materials
