Ectopic expression of vascular cell adhesion molecule-1 as a new mechanism for tumor immune evasion
- PMID: 17308126
- PMCID: PMC3172051
- DOI: 10.1158/0008-5472.CAN-06-3014
Ectopic expression of vascular cell adhesion molecule-1 as a new mechanism for tumor immune evasion
Abstract
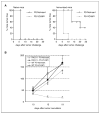
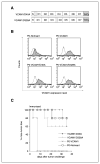
Immune escape is an important reason why the immune system cannot control tumor growth, but how escape variants emerge during immunotherapy remains poorly understood. Here, we identify a new mechanism of tumor immune escape using an in vivo selection strategy. We generated a highly immune-resistant cancer cell line (P3) by subjecting a susceptible cancer cell line (P0/TC-1) to multiple rounds of in vivo immune selection. Microarray analysis of P0 and P3 revealed that vascular cell adhesion molecule-1 (VCAM-1) is up-regulated in the P3-resistant variant. Retroviral transfer of VCAM-1 into P0 significantly increased its resistance against a vaccine-induced immune response. Analysis of tumors showed a dramatic decrease in the number of tumor-infiltrating cluster of differentiation 8(+) (CD8(+)) T cells in the tumors expressing VCAM-1. In vitro transwell migration assays showed that VCAM-1 can promote the migration of CD8(+) T cells through its interaction with the alpha(4)beta(1) integrin. Site-directed mutagenesis of VCAM-1 at amino acid residues required for interaction with alpha(4)beta(1) integrin completely abolished the immune resistance conferred by VCAM-1 in vivo. Surface staining showed that most renal cell carcinomas (RCC) express VCAM-1, whereas an RCC that responded to vaccination was VCAM-1 negative. These data provide evidence that tumor expression of VCAM-1 represents a new mechanism of immune evasion and has important implications for the development of immunotherapy for human RCC.
Figures


Similar articles
-
Enhancement of vaccinia vaccine potency by linkage of tumor antigen gene to gene encoding calreticulin.Vaccine. 2004 Sep 28;22(29-30):3993-4001. doi: 10.1016/j.vaccine.2004.03.057. Vaccine. 2004. PMID: 15364449
-
High affinity interaction of integrin alpha4beta1 (VLA-4) and vascular cell adhesion molecule 1 (VCAM-1) enhances migration of human melanoma cells across activated endothelial cell layers.J Cell Physiol. 2007 Aug;212(2):368-74. doi: 10.1002/jcp.21029. J Cell Physiol. 2007. PMID: 17352405
-
Monitoring the trafficking of adoptively transferred antigen- specific CD8-positive T cells in vivo, using noninvasive luminescence imaging.Hum Gene Ther. 2007 Jul;18(7):575-88. doi: 10.1089/hum.2007.038. Hum Gene Ther. 2007. PMID: 17576157
-
The role of vascular cell adhesion molecule-1 in tumor immune evasion.Cancer Res. 2007 Jul 1;67(13):6003-6. doi: 10.1158/0008-5472.CAN-07-1543. Cancer Res. 2007. PMID: 17616653 Free PMC article. Review.
-
Ectopic Tumor VCAM-1 Expression in Cancer Metastasis and Therapy Resistance.Cells. 2022 Dec 4;11(23):3922. doi: 10.3390/cells11233922. Cells. 2022. PMID: 36497180 Free PMC article. Review.
Cited by
-
Therapeutic anti-tumor vaccines: from tumor inhibition to enhancement.Clin Med Oncol. 2008;2:237-45. doi: 10.4137/cmo.s538. Epub 2008 Apr 29. Clin Med Oncol. 2008. PMID: 21892285 Free PMC article.
-
VCAM-1 promotes osteolytic expansion of indolent bone micrometastasis of breast cancer by engaging α4β1-positive osteoclast progenitors.Cancer Cell. 2011 Dec 13;20(6):701-14. doi: 10.1016/j.ccr.2011.11.002. Epub 2011 Dec 1. Cancer Cell. 2011. PMID: 22137794 Free PMC article.
-
Single-Cell RNA-seq Reveals Characteristics of Malignant Cells and Immune Microenvironment in Subcutaneous Panniculitis-Like T-Cell Lymphoma.Front Oncol. 2021 Mar 18;11:611580. doi: 10.3389/fonc.2021.611580. eCollection 2021. Front Oncol. 2021. PMID: 33816243 Free PMC article.
-
Immune-mediated tumor evolution: Nanog links the emergence of a stem like cancer cell state and immune evasion.Oncoimmunology. 2014 Jul 3;3(7):e947871. doi: 10.4161/21624011.2014.947871. eCollection 2014. Oncoimmunology. 2014. PMID: 25610734 Free PMC article.
-
Bortezomib enhances antigen-specific cytotoxic T cell responses against immune-resistant cancer cells generated by STAT3-ablated dendritic cells.Pharmacol Res. 2013 May;71:23-33. doi: 10.1016/j.phrs.2013.02.001. Epub 2013 Feb 18. Pharmacol Res. 2013. PMID: 23428347 Free PMC article.
References
-
- Boon T, Cerottini JC, Van den Eynde B, van der Bruggen P, Van Pel A. Tumor antigens recognized by T lymphocytes. Annu Rev Immunol. 1994;12:337–65. - PubMed
-
- Pardoll DM. Spinning molecular immunology into successful immunotherapy. Nat Rev Immunol. 2002;2:227–38. - PubMed
-
- Dunn GP, Old LJ, Schreiber RD. The three Es of cancer immunoediting. Annu Rev Immunol. 2004;22:329–60. - PubMed
Publication types
MeSH terms
Substances
Grants and funding
LinkOut - more resources
Full Text Sources
Other Literature Sources
Molecular Biology Databases
Research Materials
Miscellaneous

