

Review
doi: 10.1016/j.ceb.2007.02.010.
Epub 2007 Feb 16.
Receptor tyrosine kinases: mechanisms of activation and signaling
Affiliations
- PMID: 17306972
- PMCID: PMC2536775
- DOI: 10.1016/j.ceb.2007.02.010
Item in Clipboard
Review
Receptor tyrosine kinases: mechanisms of activation and signaling
Curr Opin Cell Biol.
2007 Apr.
Abstract
Receptor tyrosine kinases (RTKs) are essential components of signal transduction pathways that mediate cell-to-cell communication. These single-pass transmembrane receptors, which bind polypeptide ligands - mainly growth factors - play key roles in processes such as cellular growth, differentiation, metabolism and motility. Recent progress has been achieved towards an understanding of the precise (and varied) mechanisms by which RTKs are activated by ligand binding and by which signals are propagated from the activated receptors to downstream targets in the cell.
Figures
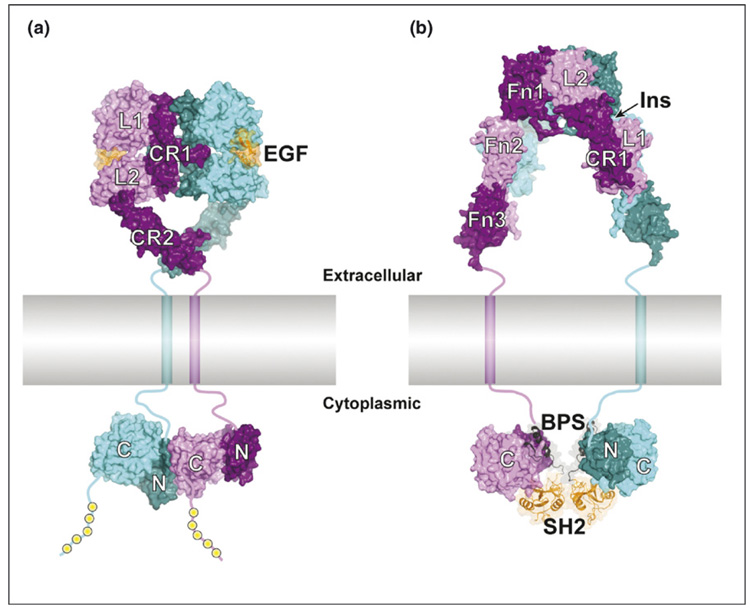
Modes of RTK dimerization and downstream protein recruitment. (a) Structural model of the activated EGF–EGFR complex. On the extracellular side of the plasma membrane (colored gray and shown approximately to scale), the 2:2 EGF:EGFR complex is two-fold symmetric (dyad axis is vertical). The two receptors in the complex are colored cyan and purple (alternating light and dark coloring for the subdomains), and the two EGF molecules are colored orange (ribbon diagram with semi-transparent surface). The four subdomains of the EGFR ectodomain are, sequentially, L1–CR1–L2–CR2. The transmembrane helices are shown as cylinders, and linker segments (juxtamembrane regions [extra- and intracellular] and C-terminal tail) are drawn schematically as thick lines. On the cytoplasmic side, the two tyrosine kinase domains (N- and C-lobes colored dark and light, respectively) form an asymmetric dimer, with the C-lobe of one kinase domain (purple) interacting with the N-lobe of the other kinase domain (cyan). This interaction activates the second kinase domain (cyan) [10••]. The yellow spheres represent phosphotyrosine recruitment sites in the C-terminal tail of the cytoplasmic domain. The structures are derived from PDB codes 1IVO [48] and 1NQL [49] (ectodomain dimer) and 1M14 [50] (kinase dimer). (b) Structural model of the α2β2 insulin receptor with Grb14 bound. The insulin receptor ectodomain is two-fold symmetric (dyad axis is vertical) and consists, sequentially, of subdomains L1–CR1–L2–Fn1–Fn2–Fn3, of which L1–CR1–L2–Fn1–Fn2(N) are on the α chain and Fn2(C)–Fn3 are on the β chain (the chains are not distinguished in the figure). The tyrosine kinase domains (β chain) are colored as in (a). The BPS–SH2 portion of Grb14 (ribbon diagram with semi-transparent surface) binds to the kinase domain (2:2 complex) and inhibits catalytic activity. The SH2 domain (orange) mediates Grb14 dimerization and the BPS region (black) binds as a pseudosubstrate inhibitor in the kinase active site. The structures are derived from PDB codes 2DTG [16••] (ectodomain) and 2AUG and 2AUH [21•] (Grb14-IRK complex). Insulin is not bound to the ectodomain in this structure, but its presumed binding site (one of two equivalent sites) between L1 (α-chain 1) and Fn1 (α-chain 2) is indicated by the arrow. In both (a) and (b), the distance between the transmembrane helices is somewhat arbitrary, owing to the (presumed) flexible linkers connecting CR2 (a) and Fn3 (b).
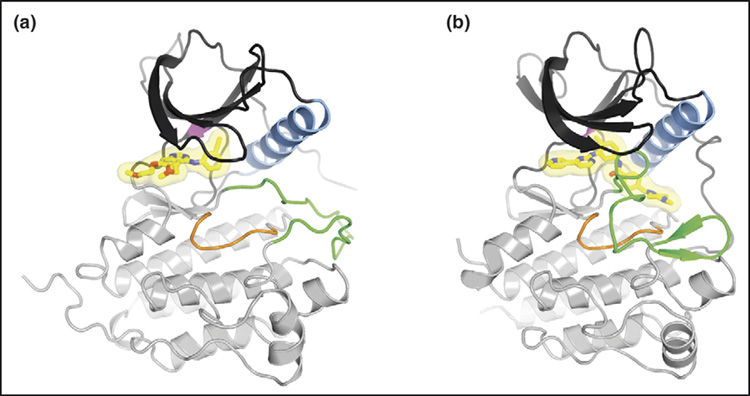
Binding of small-molecule inhibitors to RTKs. The ATP-competitive inhibitors are shown in stick representation with a semi-transparent surface. Carbon atoms are colored yellow, oxygen atoms red, and nitrogen atoms blue. (a) Crystal structure of the tyrosine kinase domain of the EGFR kinase domain in complex with erlotinib (Tarceva) [50]. (b) Crystal structure of the tyrosine kinase domain of Kit in complex with imatinib (Gleevec) [51]. For both (a) and (b), the N-lobe of the kinase is colored dark gray, the C-lobe light gray, α-helix C (N-lobe) light blue, the catalytic loop (C-lobe) orange, and the activation loop (C-lobe) green. The activation loop in (a) is in an active state, whereas the activation loop in (b) is in an autoinhibited, inactive state. The ‘gatekeeper’ residue (Thr790 in EGFR, Thr670 in Kit), which when mutated causes drug resistance to both erlotinib and imatinib, is colored magenta (in the back of the N-lobe).
Similar articles
-
Crosstalk coregulation mechanisms of G protein-coupled receptors and receptor tyrosine kinases.Methods Mol Biol. 2006;332:51-77. doi: 10.1385/1-59745-048-0:51. Methods Mol Biol. 2006. PMID: 16878685 Review.
-
Cell communication networks: epidermal growth factor receptor transactivation as the paradigm for interreceptor signal transmission.Oncogene. 2001 Mar 26;20(13):1594-600. doi: 10.1038/sj.onc.1204192. Oncogene. 2001. PMID: 11313906 Review.
-
Autoinhibitory mechanisms in receptor tyrosine kinases.Front Biosci. 2002 Feb 1;7:d330-40. doi: 10.2741/A778. Front Biosci. 2002. PMID: 11815286 Review.
-
Signal transduction pathways of G protein-coupled receptors and their cross-talk with receptor tyrosine kinases: lessons from bradykinin signaling.Curr Med Chem. 2000 Sep;7(9):911-43. doi: 10.2174/0929867003374589. Curr Med Chem. 2000. PMID: 10911023 Review.
-
Structural analysis of receptor tyrosine kinases.Prog Biophys Mol Biol. 1999;71(3-4):343-58. doi: 10.1016/s0079-6107(98)00047-9. Prog Biophys Mol Biol. 1999. PMID: 10354703 Review.
Cited by
-
Cell-cell communication: new insights and clinical implications.Signal Transduct Target Ther. 2024 Aug 7;9(1):196. doi: 10.1038/s41392-024-01888-z. Signal Transduct Target Ther. 2024. PMID: 39107318 Free PMC article. Review.
-
Eph/ephrin recognition and the role of Eph/ephrin clusters in signaling initiation.Biochim Biophys Acta. 2013 Oct;1834(10):2160-5. doi: 10.1016/j.bbapap.2013.04.020. Epub 2013 Apr 26. Biochim Biophys Acta. 2013. PMID: 23628727 Free PMC article. Review.
-
Two-step release of kinase autoinhibition in discoidin domain receptor 1.Proc Natl Acad Sci U S A. 2020 Sep 8;117(36):22051-22060. doi: 10.1073/pnas.2007271117. Epub 2020 Aug 24. Proc Natl Acad Sci U S A. 2020. PMID: 32839343 Free PMC article.
-
Non-Receptor Tyrosine Kinases: Their Structure and Mechanistic Role in Tumor Progression and Resistance.Cancers (Basel). 2024 Aug 2;16(15):2754. doi: 10.3390/cancers16152754. Cancers (Basel). 2024. PMID: 39123481 Free PMC article. Review.
-
Anti-angiogenic tyrosine kinase inhibitors: what is their mechanism of action?Angiogenesis. 2010 Mar;13(1):1-14. doi: 10.1007/s10456-009-9160-6. Epub 2009 Dec 11. Angiogenesis. 2010. PMID: 20012482 Free PMC article. Review.
References
-
- Robinson DR, Wu YM, Lin SF. The protein tyrosine kinase family of the human genome. Oncogene. 2000;19:5548–5557. - PubMed
-
- Blume-Jensen P, Hunter T. Oncogenic kinase signalling. Nature. 2001;411:355–365. - PubMed
-
- Schlessinger J. Cell signaling by receptor tyrosine kinases. Cell. 2000;103:211–225. - PubMed
-
- Hubbard SR. Juxtamembrane autoinhibition in receptor tyrosine kinases. Nat Rev Mol Cell Biol. 2004;5:464–471. - PubMed
-
- Pawson T, Gish GD, Nash P. SH2 domains, interaction modules and cellular wiring. Trends Cell Biol. 2001;11:504–511. - PubMed
Publication types
MeSH terms
Substances
Grants and funding
LinkOut - more resources
Full Text Sources
Other Literature Sources
