

High-throughput sequencing of Arabidopsis microRNAs: evidence for frequent birth and death of MIRNA genes
- PMID: 17299599
- PMCID: PMC1790633
- DOI: 10.1371/journal.pone.0000219
High-throughput sequencing of Arabidopsis microRNAs: evidence for frequent birth and death of MIRNA genes
Abstract
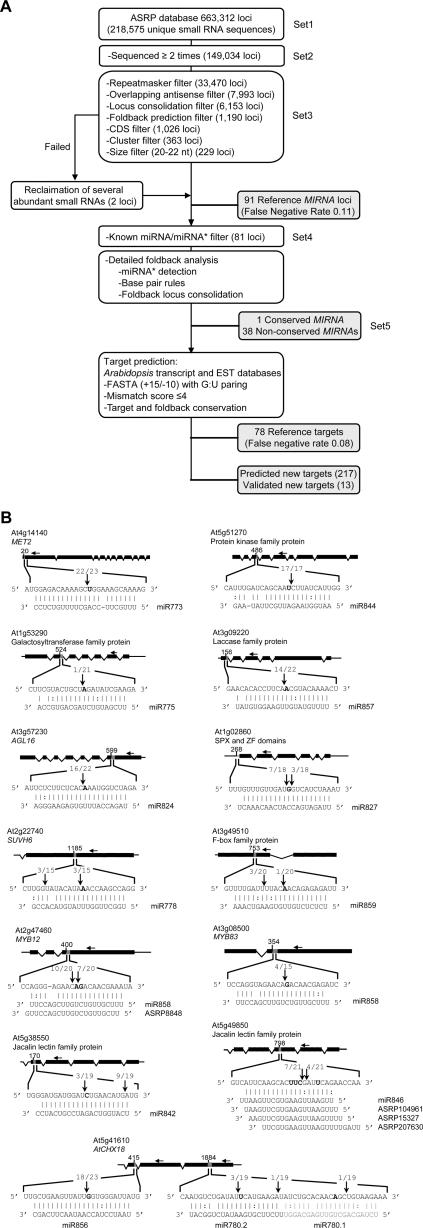
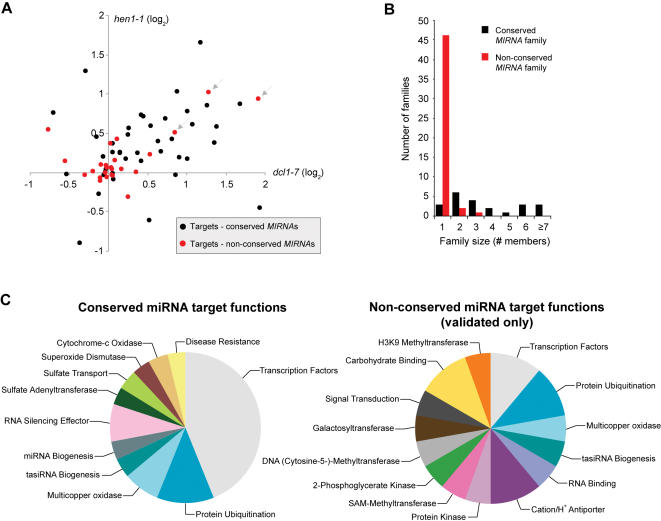
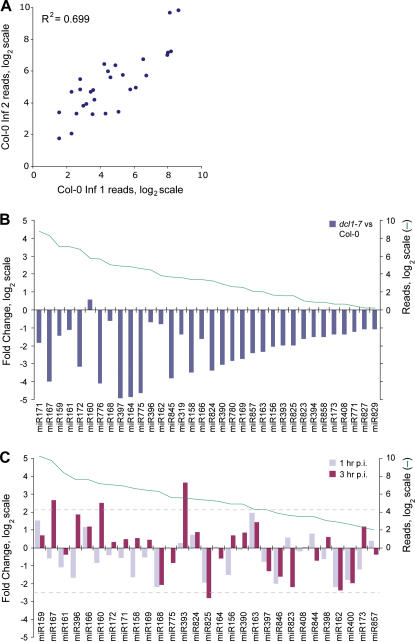
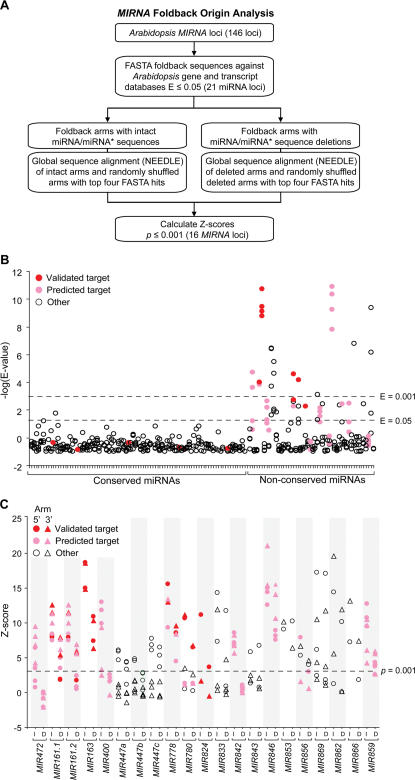
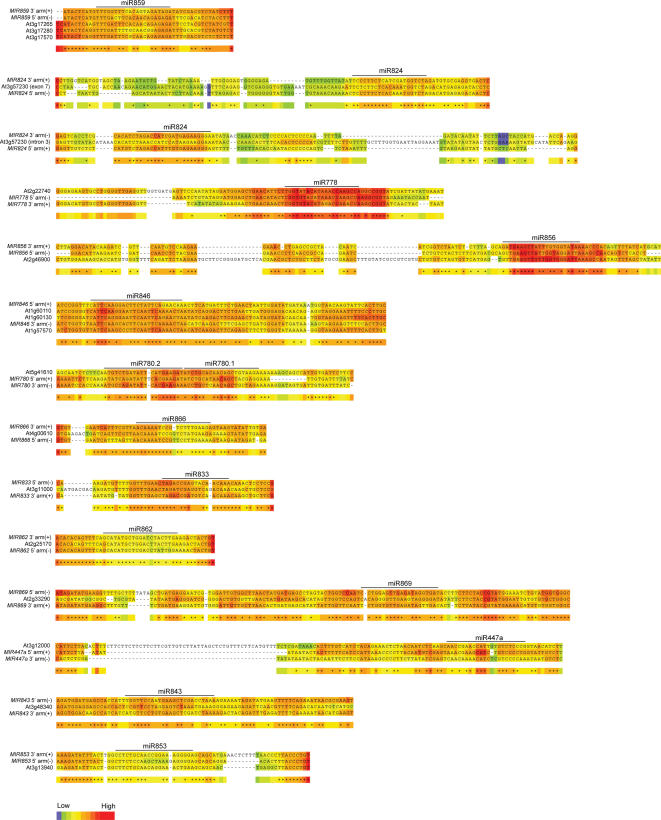
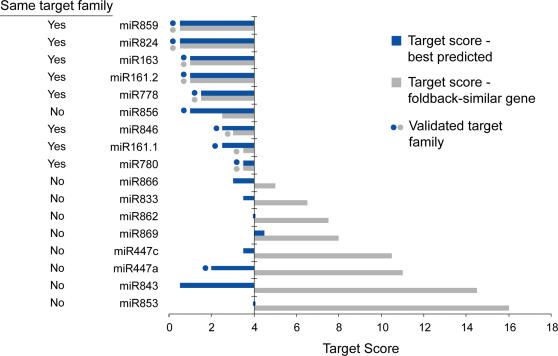
In plants, microRNAs (miRNAs) comprise one of two classes of small RNAs that function primarily as negative regulators at the posttranscriptional level. Several MIRNA genes in the plant kingdom are ancient, with conservation extending between angiosperms and the mosses, whereas many others are more recently evolved. Here, we use deep sequencing and computational methods to identify, profile and analyze non-conserved MIRNA genes in Arabidopsis thaliana. 48 non-conserved MIRNA families, nearly all of which were represented by single genes, were identified. Sequence similarity analyses of miRNA precursor foldback arms revealed evidence for recent evolutionary origin of 16 MIRNA loci through inverted duplication events from protein-coding gene sequences. Interestingly, these recently evolved MIRNA genes have taken distinct paths. Whereas some non-conserved miRNAs interact with and regulate target transcripts from gene families that donated parental sequences, others have drifted to the point of non-interaction with parental gene family transcripts. Some young MIRNA loci clearly originated from one gene family but form miRNAs that target transcripts in another family. We suggest that MIRNA genes are undergoing relatively frequent birth and death, with only a subset being stabilized by integration into regulatory networks.
Conflict of interest statement
Figures
Similar articles
-
MicroRNA gene evolution in Arabidopsis lyrata and Arabidopsis thaliana.Plant Cell. 2010 Apr;22(4):1074-89. doi: 10.1105/tpc.110.073999. Epub 2010 Apr 20. Plant Cell. 2010. PMID: 20407027 Free PMC article.
-
Conservation and divergence of microRNAs in Populus.BMC Genomics. 2007 Dec 31;8:481. doi: 10.1186/1471-2164-8-481. BMC Genomics. 2007. PMID: 18166134 Free PMC article.
-
Significant sequence similarities in promoters and precursors of Arabidopsis thaliana non-conserved microRNAs.Bioinformatics. 2006 Nov 1;22(21):2585-9. doi: 10.1093/bioinformatics/btl437. Epub 2006 Aug 10. Bioinformatics. 2006. PMID: 16901935
-
Conservation and divergence in plant microRNAs.Plant Mol Biol. 2012 Sep;80(1):3-16. doi: 10.1007/s11103-011-9829-2. Epub 2011 Oct 14. Plant Mol Biol. 2012. PMID: 21996939 Review.
-
Evolution and functional diversification of MIRNA genes.Plant Cell. 2011 Feb;23(2):431-42. doi: 10.1105/tpc.110.082784. Epub 2011 Feb 11. Plant Cell. 2011. PMID: 21317375 Free PMC article. Review.
Cited by
-
Identification and characterization of microRNAs from peanut (Arachis hypogaea L.) by high-throughput sequencing.PLoS One. 2011;6(11):e27530. doi: 10.1371/journal.pone.0027530. Epub 2011 Nov 16. PLoS One. 2011. PMID: 22110666 Free PMC article.
-
Functional specialization of the plant miR396 regulatory network through distinct microRNA-target interactions.PLoS Genet. 2012 Jan;8(1):e1002419. doi: 10.1371/journal.pgen.1002419. Epub 2012 Jan 5. PLoS Genet. 2012. PMID: 22242012 Free PMC article.
-
A combined approach of high-throughput sequencing and degradome analysis reveals tissue specific expression of microRNAs and their targets in cucumber.PLoS One. 2012;7(3):e33040. doi: 10.1371/journal.pone.0033040. Epub 2012 Mar 30. PLoS One. 2012. PMID: 22479356 Free PMC article.
-
Elucidation of miRNAs-mediated responses to low nitrogen stress by deep sequencing of two soybean genotypes.PLoS One. 2013 Jul 8;8(7):e67423. doi: 10.1371/journal.pone.0067423. Print 2013. PLoS One. 2013. PMID: 23861762 Free PMC article.
-
DICER-LIKE3 activity in Physcomitrella patens DICER-LIKE4 mutants causes severe developmental dysfunction and sterility.Mol Plant. 2012 Nov;5(6):1281-94. doi: 10.1093/mp/sss036. Epub 2012 Apr 17. Mol Plant. 2012. PMID: 22511605 Free PMC article.
References
-
- Meister G, Tuschl T. Mechanisms of gene silencing by double-stranded RNA. Nature. 2004;431:343–349. - PubMed
-
- Baulcombe D. RNA silencing in plants. Nature. 2004;431:356–363. - PubMed
-
- Tomari Y, Zamore PD. Perspective: machines for RNAi. Genes Dev. 2005;19:517–529. - PubMed
-
- Hall TM. Structure and function of Argonaute proteins. Structure (Camb) 2005;13:1403–1408. - PubMed
-
- Hammond SM. Dicing and slicing The core machinery of the RNA interference pathway. FEBS Lett. 2005;579:5822–5829. - PubMed
Publication types
MeSH terms
Substances
Grants and funding
LinkOut - more resources
Full Text Sources
Other Literature Sources
Molecular Biology Databases
