

MyriMatch: highly accurate tandem mass spectral peptide identification by multivariate hypergeometric analysis
- PMID: 17269722
- PMCID: PMC2525619
- DOI: 10.1021/pr0604054
MyriMatch: highly accurate tandem mass spectral peptide identification by multivariate hypergeometric analysis
Abstract
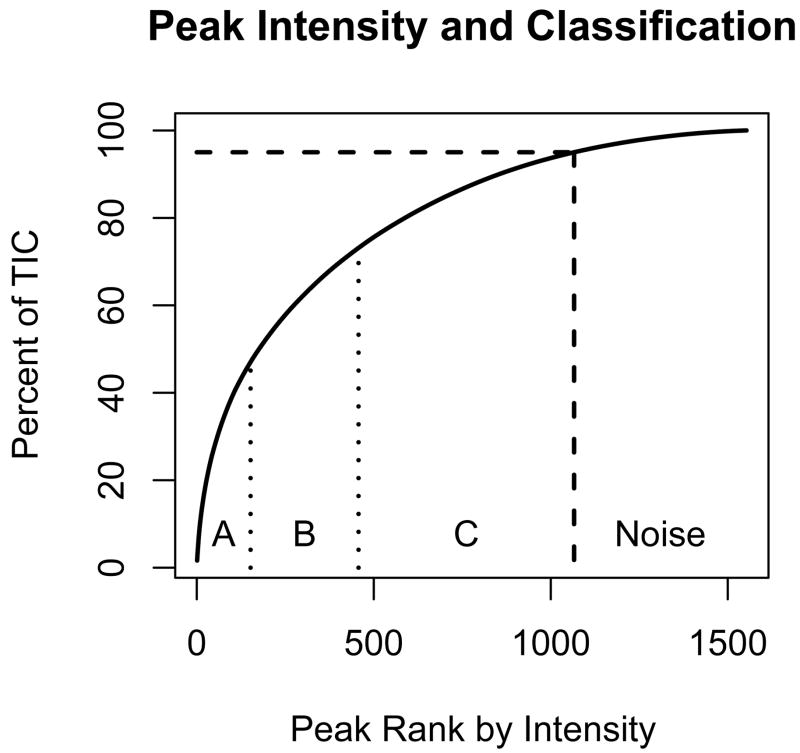
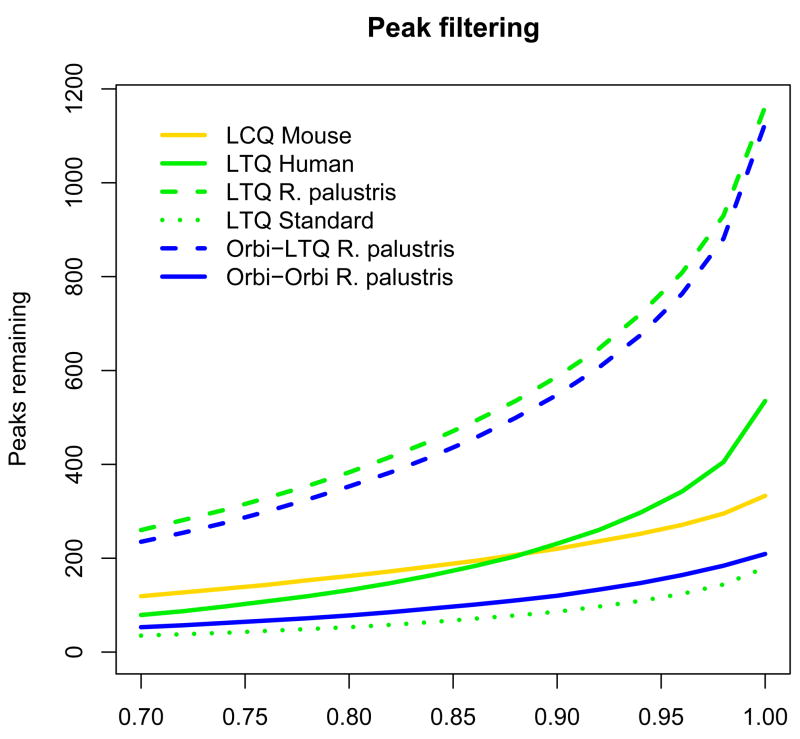
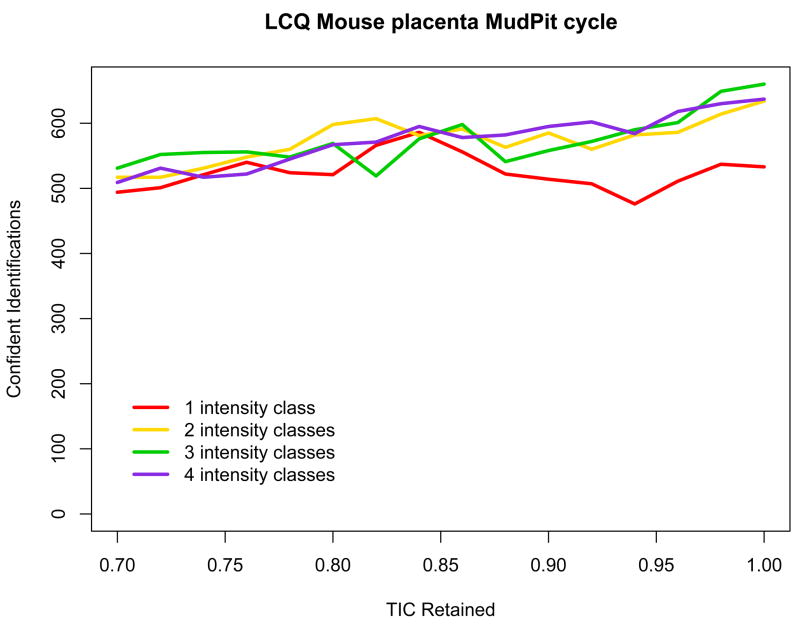
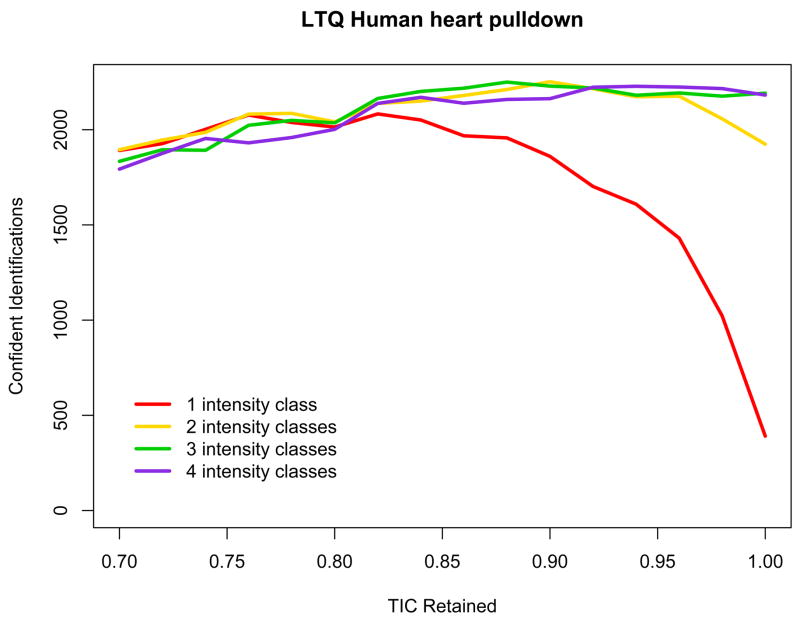
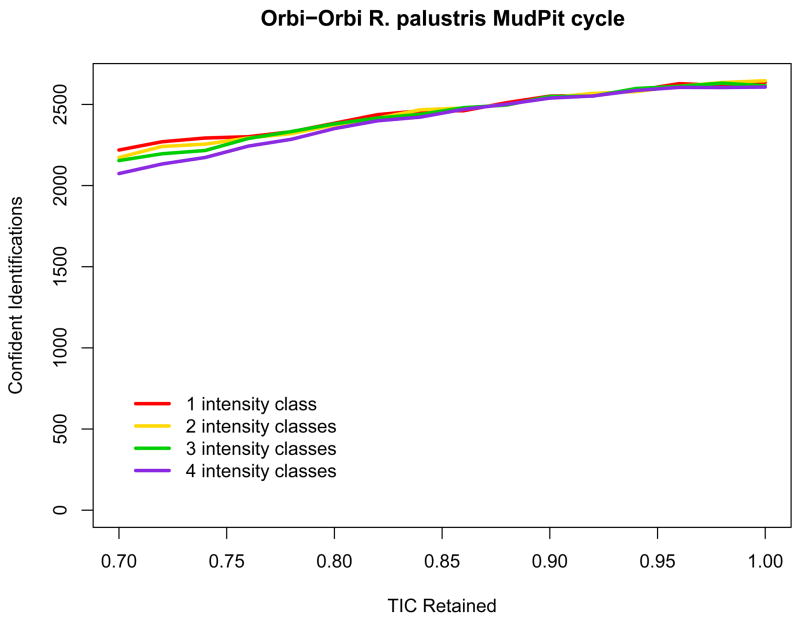
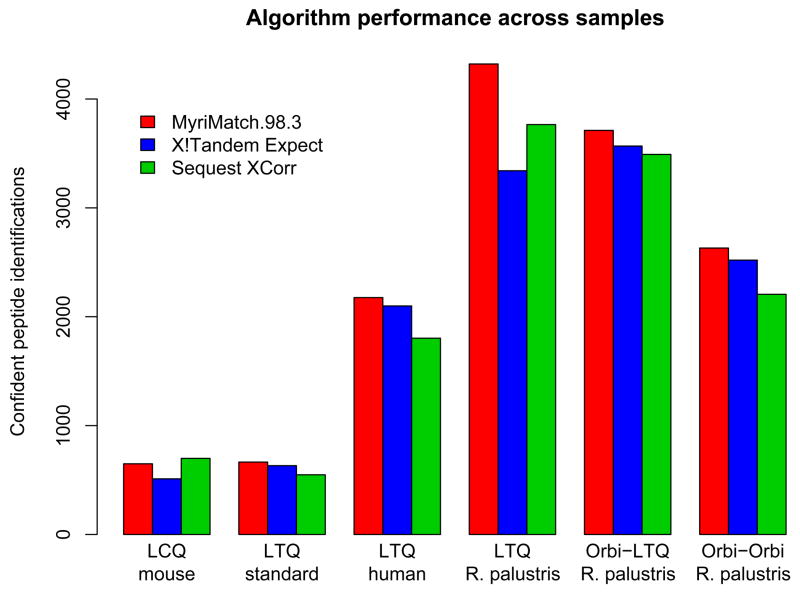
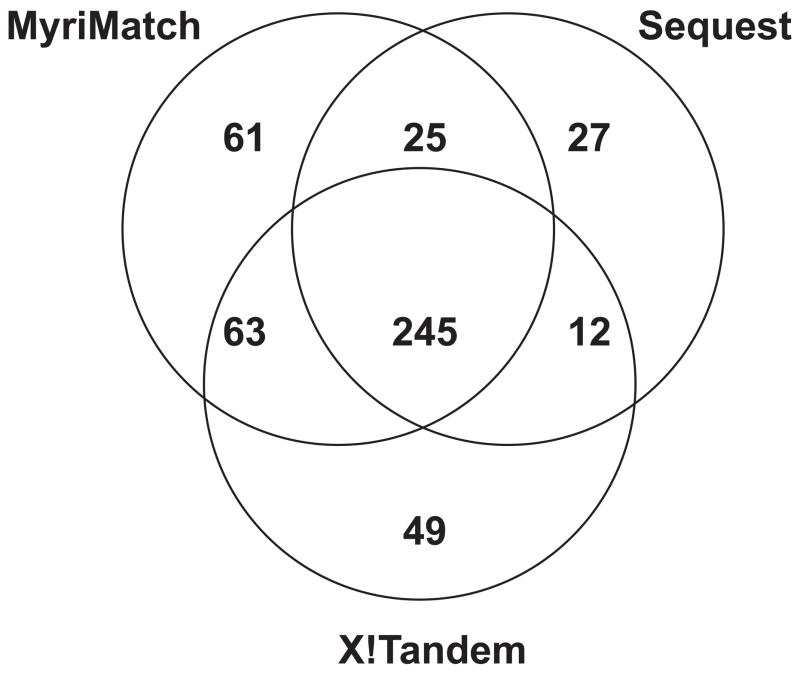
Shotgun proteomics experiments are dependent upon database search engines to identify peptides from tandem mass spectra. Many of these algorithms score potential identifications by evaluating the number of fragment ions matched between each peptide sequence and an observed spectrum. These systems, however, generally do not distinguish between matching an intense peak and matching a minor peak. We have developed a statistical model to score peptide matches that is based upon the multivariate hypergeometric distribution. This scorer, part of the "MyriMatch" database search engine, places greater emphasis on matching intense peaks. The probability that the best match for each spectrum has occurred by random chance can be employed to separate correct matches from random ones. We evaluated this software on data sets from three different laboratories employing three different ion trap instruments. Employing a novel system for testing discrimination, we demonstrate that stratifying peaks into multiple intensity classes improves the discrimination of scoring. We compare MyriMatch results to those of Sequest and X!Tandem, revealing that it is capable of higher discrimination than either of these algorithms. When minimal peak filtering is employed, performance plummets for a scoring model that does not stratify matched peaks by intensity. On the other hand, we find that MyriMatch discrimination improves as more peaks are retained in each spectrum. MyriMatch also scales well to tandem mass spectra from high-resolution mass analyzers. These findings may indicate limitations for existing database search scorers that count matched peaks without differentiating them by intensity. This software and source code is available under Mozilla Public License at this URL: http://www.mc.vanderbilt.edu/msrc/bioinformatics/.
Figures
Similar articles
-
Denoising peptide tandem mass spectra for spectral libraries: a Bayesian approach.J Proteome Res. 2013 Jul 5;12(7):3223-32. doi: 10.1021/pr400080b. Epub 2013 Jun 6. J Proteome Res. 2013. PMID: 23675732
-
Statistical models for protein validation using tandem mass spectral data and protein amino acid sequence databases.Anal Chem. 2004 Mar 15;76(6):1664-71. doi: 10.1021/ac035112y. Anal Chem. 2004. PMID: 15018565
-
[A novel approach for peptide identification by tandem mass spectrometry].Sheng Wu Hua Xue Yu Sheng Wu Wu Li Xue Bao (Shanghai). 2003 Aug;35(8):734-40. Sheng Wu Hua Xue Yu Sheng Wu Wu Li Xue Bao (Shanghai). 2003. PMID: 12897969 Chinese.
-
Combining results of multiple search engines in proteomics.Mol Cell Proteomics. 2013 Sep;12(9):2383-93. doi: 10.1074/mcp.R113.027797. Epub 2013 May 29. Mol Cell Proteomics. 2013. PMID: 23720762 Free PMC article. Review.
-
Unknown identification using reference mass spectra. Quality evaluation of databases.J Am Soc Mass Spectrom. 1999 Dec;10(12):1229-40. doi: 10.1016/S1044-0305(99)00104-X. J Am Soc Mass Spectrom. 1999. PMID: 10584326 Review.
Cited by
-
Proteomic Analysis of a Poplar Cell Suspension Culture Suggests a Major Role of Protein S-Acylation in Diverse Cellular Processes.Front Plant Sci. 2016 Apr 12;7:477. doi: 10.3389/fpls.2016.00477. eCollection 2016. Front Plant Sci. 2016. PMID: 27148305 Free PMC article.
-
NuRD subunit CHD4 regulates super-enhancer accessibility in rhabdomyosarcoma and represents a general tumor dependency.Elife. 2020 Aug 3;9:e54993. doi: 10.7554/eLife.54993. Elife. 2020. PMID: 32744500 Free PMC article.
-
Obesity and altered glucose metabolism impact HDL composition in CETP transgenic mice: a role for ovarian hormones.J Lipid Res. 2012 Mar;53(3):379-389. doi: 10.1194/jlr.M019752. Epub 2012 Jan 3. J Lipid Res. 2012. PMID: 22215797 Free PMC article.
-
Active anaerobic methane oxidation and sulfur disproportionation in the deep terrestrial subsurface.ISME J. 2022 Jun;16(6):1583-1593. doi: 10.1038/s41396-022-01207-w. Epub 2022 Feb 16. ISME J. 2022. PMID: 35173296 Free PMC article.
-
Proteomic parsimony through bipartite graph analysis improves accuracy and transparency.J Proteome Res. 2007 Sep;6(9):3549-57. doi: 10.1021/pr070230d. Epub 2007 Aug 4. J Proteome Res. 2007. PMID: 17676885 Free PMC article.
References
-
- Eng JK, McCormack AL, Yates JR., 3rd J Am Soc Mass Spectrom. 1994;5:976–989. - PubMed
-
- Perkins DN, Pappin DJ, Creasy DM, Cottrell JS. Electrophoresis. 1999;20:3551–67. - PubMed
-
- Fridman T, Razumovskaya J, Verberkmoes N, Hurst G, Protopopescu V, Xu Y. J Bioinform Comput Biol. 2005;3:455–76. - PubMed
-
- Geer LY, Markey SP, Kowalak JA, Wagner L, Xu M, Maynard DM, Yang X, Shi W, Bryant SH. J Proteome Res. 2004;3:958–64. - PubMed
-
- Zhang N, Aebersold R, Schwikowski B. Proteomics. 2002;2:1406–12. - PubMed
Publication types
MeSH terms
Substances
Grants and funding
LinkOut - more resources
Full Text Sources
Other Literature Sources
Molecular Biology Databases
