Comparative Study
. 2007 Jan 31;27(5):1129-38.
doi: 10.1523/JNEUROSCI.4468-06.2007.

Three distinct mechanisms generate oxygen free radicals in neurons and contribute to cell death during anoxia and reoxygenation

Affiliations
Comparative Study

Three distinct mechanisms generate oxygen free radicals in neurons and contribute to cell death during anoxia and reoxygenation

Andrey Y Abramov et al. J Neurosci. .

Abstract

Ischemia is a major cause of brain damage, and patient management is complicated by the paradoxical injury that results from reoxygenation. We have now explored the generation of reactive oxygen species (ROS) in hippocampal and cortical neurons in culture in response to oxygen and glucose deprivation or metabolic inhibition and reoxygenation. Fluorescence microscopy was used to measure the rate of ROS generation using hydroethidine, dicarboxyfluorescein diacetate, or MitoSOX. ROS generation was correlated with changing mitochondrial potential (rhodamine 123), [Ca2+]c (fluo-4, fura-2, or Indo-1), or ATP consumption, indicated by increased [Mg2+]c. We found that three distinct mechanisms contribute to neuronal injury by generating ROS and oxidative stress, each operating at a different stage of ischemia and reperfusion. In response to hypoxia, mitochondria generate an initial burst of ROS, which is curtailed once mitochondria depolarize or prevented by previous depolarization with uncoupler. A second phase of ROS generation that followed after a delay was blocked by the xanthine oxidase (XO) inhibitor oxypurinol. This phase correlated with a rise in [Mg2+]c, suggesting XO activation by accumulating products of ATP consumption. A third phase of ROS generation appeared at reoxygenation. This was blocked by NADPH oxidase inhibitors and was absent in cells from gp91(phox-/-) knock-out mice. It was Ca2+ dependent, suggesting activation by increased [Ca2+]c during anoxia, itself partly attributable to glutamate release. Inhibition of either the NADPH oxidase or XO was significantly neuroprotective. Thus, oxidative stress contributes to cell death over and above the injury attributable to energy deprivation.


Figures
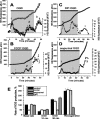
Figure 1.
Figure 1.
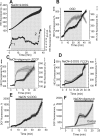
OGD–reoxygenation induces three distinct phases of ROS production in primary hippocampal and cortical neurons. The traces (A–D) show fluorescence measurements from single representative hippocampal neurons (at 10–15 DIV) in the continual presence of HEt (2 μm). The bottom traces (●) in all panels shows the HEt signal after differentiation, showing the rate of change of the signal as a function of time, an index of the rate of oxidation and therefore of the rate of ROS generation. The key phases of ROS generation (or the time at which they would be expected in control experiments) are indicated as 1, 2, and 3. OGD caused progressive changes in the rate of HEt oxidation, as shown in A. The specific roles of different mechanisms were identified as follows: (1) mitochondrial depolarization using 0.5 μm FCCP (B, E) abolished mitochondrial ROS generation and eliminated phase 1; (2) inhibition of XO using 20 μm oxypurinol (C, E) abolished phase 2, whereas inhibition of the NADPH oxidase with DPI (0.5 μm) blocked phase 3. The histogram shown in E summarizes the data showing the mean rates of ROS production at different times of OGD, shown as percentage of the basal rate of change of HEt fluorescence, where 100% is the basal rate in control cells. Error bars indicate SEM.
Figure 2.
Figure 2.
Mitochondrial ROS generation is curtailed by loss of mitochondrial membrane potential. Cells were exposed to 1 mm NaCN plus 5 mm 2-DOG to inhibit respiration in the presence of oxygen to determine the limits of ROS generation by the respiratory chain (A). The bottom trace shows the differentiated HEt signal, showing that ROS generation in phase 1 was prolonged under these conditions. In B, simultaneous measurements of the rate of ROS production (HEt) and mitochondrial membrane potential (Rh123 fluorescence) during OGD/reoxygenation are shown. Cessation of phase 1 ROS generation coincided with mitochondrial depolarization. C, In response to CN plus 2-DOG, mitochondrial depolarization was slowed by the reversed ATP synthase, and ROS generation was prolonged. Inhibition of the ATPase with oligomycin (0.2 mg/ml) (D) accelerated the collapse of potential, which brought ROS generation to a stop. E and F confirm the results shown in C and D using a different ROS indicator, DCF. All traces represent the mean value of all neurons within the microscopic field of view (7–30 cells) representing one of three to seven experiments.
Figure 3.
Figure 3.
Rates of neuronal ROS production in response to inhibition of mitochondrial respiration. The specific roles of mitochondria in ROS generation were studied further using the mitochondrially localized ROS fluorescent indicator MitoSOX. Traces A–C show the mean values measured from all neurons in a field of view in one representative experiment. MitSOX fluorescence was measured simultaneously with Rh123 during OGD/reoxygenation, and confirms that mitochondrial ROS generation is seen only before mitochondrial potential is lost. An additional increase in signal was seen on reperfusion. Inhibition of respiration with 1 mm NaCN in the presence of 0.2 mg/ml oligomycin (B) also induced multiphasic changes in ROS production (illustrated again below as the differentiated HEt trace). C, Another inhibitor of complex IV (1 mm NaN3) in the presence of 0.2 mg/ml oligomycin caused a very similar sequence of changes in ROS generation. These data are summarized in D, in which the rates of ROS production during mitochondrial inhibition are illustrated, and the underlying mechanisms were again tested using FCCP (0.5 μm), oxypurinol (20 μm), and DPI (0.5 μm). Error bars indicate SEM.
Figure 4.
Figure 4.
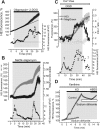
XO activation coincides with ATP depletion. Inhibition of ATP synthesis (0.2 mg/ml oligomycin plus 5 mm 2-DOG) showed a delayed activation of ROS production in hippocampal and cortical neurons (A) sensitive to oxypurinol, consistent with activation of XO by accumulating breakdown products of ATP hydrolysis. Simultaneous measurements of ROS production (HEt) and [Mg2+]c, which increases as ATP is hydrolyzed (see Results) show that phase 2 ROS generation in response to mitochondrial inhibition with CN and oligomycin coincided with ATP depletion (B) and OGD (C). ROS generation by XO is dependent on oxygen availability (D). Xanthine (250 μm) and xanthine oxidase (50 mU/ml) were used to induce O2 production, measured with HEt in cell-free saline. Depletion of the oxygen with sodium dithionite (gray) stopped ROS production, which resumed when oxygenated saline was added, showing that the dithionite did not simply reduce the HEt. All traces in A–C present the mean value of all neurons in one from three to seven experiments. D, Average of three experiments.
Figure 5.
Figure 5.
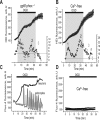
ROS generation at reoxygenation is attributable to NADPH oxidase and is calcium dependent. The rate of ROS generation at reoxygenation after OGD was much reduced in neurons from gp91phox−/− knock-out mice (A) or in Ca2+-free saline (0.5 mm EGTA) (B). C and D show that OGD caused a rise in [Ca2+]c in neurons and [Ca2+]c oscillations in astrocytes during OGD. The responses were dependent on external calcium (D). The traces in A and B represent the mean value of the signal measured from all neurons in one of three to seven experiments, whereas C and D show signals from single representative cells.
Figure 6.
Figure 6.
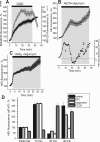
Inhibition of NMDA receptors limits ROS generation on reoxygenation and delays the second phase of ROS production during OGD and metabolic inhibition. A, The NMDA glutamate receptor antagonist (MK-801; 20 μm; 10 min preincubation) reduced the third phase (*) of ROS generation on reoxygenation after a period of OGD. MK801 also delayed the second phase of ROS generation both during OGD (A) and in the presence of NaCN plus oligomycin (B). As above, the bottom traces show the differentiated HEt signal, indicating the rate of change of fluorescence.
Figure 7.
Figure 7.
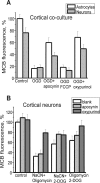
Xanthine oxidase and NADPH oxidase activation by OGD and mitochondrial inhibition cause [GSH] depletion in neurons. OGD (A) and CN with oligomycin (B) both depleted intracellular [GSH] in both neurons and astrocytes in cortical cocultures, as measured using MCB fluorescence. Inhibition of xanthine oxidase with oxypurinol or of NADPH oxidase with apocynin both significantly prevented the GSH oxidation both in response to OGD and to metabolic inhibition. Error bars indicate SEM.
Figure 8.
Figure 8.
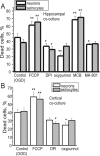
Xanthine oxidase and NADPH oxidase both contribute to OGD-induced cell death. OGD caused significant cell death of both neurons and astrocytes in hippocampal (A) and cortical (B) cultures. Pretreatment of the cells with 0.5 μm FCCP to inhibit mitochondrial ROS production was not protective. However, 0.5 μm DPI and 20 μm oxypurinol were both significantly protective, whereas depletion of GSH using MCB exacerbated cell death, strongly suggesting that oxidative stress caused by both XO and the NADPH oxidase contribute to cell death. Error bars indicate SEM. *p < 0.05; **p < 0.001.

Similar articles

Cited by

References

    1. Abramov AY, Canevari L, Duchen MR. Amyloid β-peptides induce mitochondrial dysfunction and oxidative stress in astrocytes and death of neurons through activation of NADPH oxidase. J Neurosci. 2004;24:565–575. - PMC - PubMed
    1. Abramov AY, Jacobson J, Wientjes F, Hothersall J, Canevari L, Duchen MR. Expression and modulation of an NADPH oxidase in mammalian astrocytes. J Neurosci. 2005;25:9176–9184. - PMC - PubMed
    1. Acker H. The oxygen sensing signal cascade under the influence of reactive oxygen species. Philos Trans R Soc Lond B Biol Sci. 2005;29:2201–2210. - PMC - PubMed
    1. Balthrop JE, Dameron CT, Harris ED. Comparison of pathways of copper metabolism in aorta and liver. A functional test of metallothionein. Biochem J. 1982;15:541–548. - PMC - PubMed
    1. Berry CE, Hare JM. Xanthine oxidoreductase and cardiovascular disease: molecular mechanisms and pathophysiological implications. J Physiol (Lond) 2004;16:589–606. - PMC - PubMed

Publication types