

Peroxisome proliferator-activated receptor (PPAR)alpha expression in T cells mediates gender differences in development of T cell-mediated autoimmunity
- PMID: 17261635
- PMCID: PMC2118721
- DOI: 10.1084/jem.20061839
Peroxisome proliferator-activated receptor (PPAR)alpha expression in T cells mediates gender differences in development of T cell-mediated autoimmunity
Erratum in
-
Correction: Peroxisome proliferator-activated receptor (PPAR)α expression in T cells mediates gender differences in development of T cell-mediated autoimmunity.J Exp Med. 2018 Jun 4;215(6):1765. doi: 10.1084/jem.2006183905142018c. Epub 2018 May 17. J Exp Med. 2018. PMID: 29773642 Free PMC article. No abstract available.
Abstract
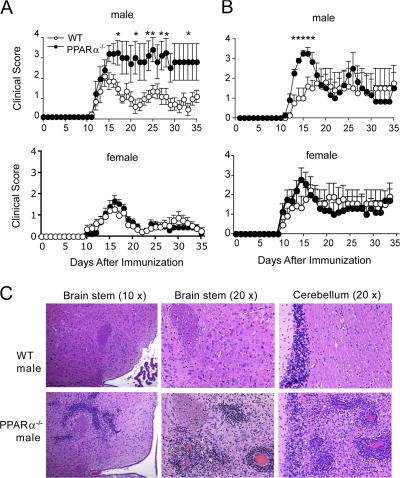
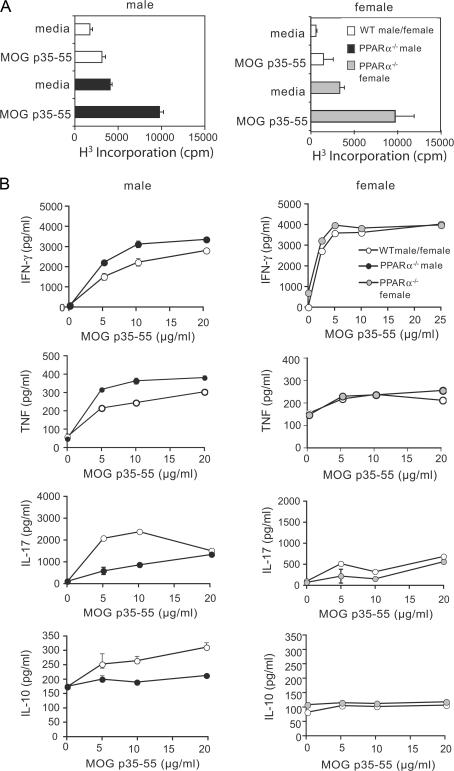
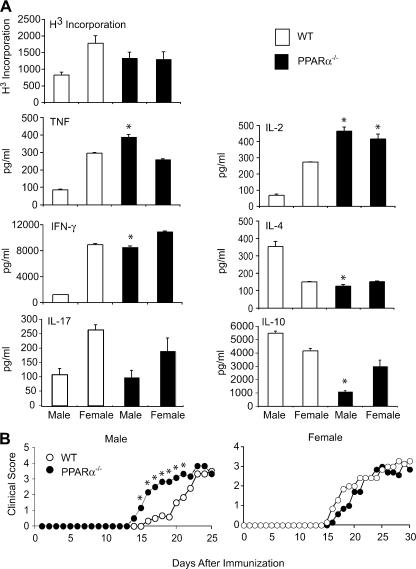
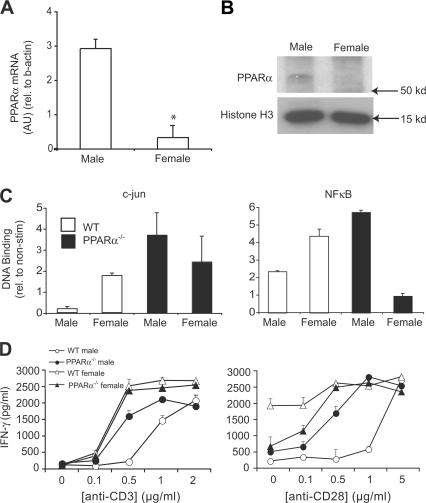
Peroxisome proliferator-activated receptor (PPAR)alpha is a nuclear receptor that mediates gender differences in lipid metabolism. PPARalpha also functions to control inflammatory responses by repressing the activity of nuclear factor kappaB (NF-kappaB) and c-jun in immune cells. Because PPARalpha is situated at the crossroads of gender and immune regulation, we hypothesized that this gene may mediate sex differences in the development of T cell-mediated autoimmune disease. We show that PPARalpha is more abundant in male as compared with female CD4(+) cells and that its expression is sensitive to androgen levels. Genetic ablation of this gene selectively removed the brake on NF-kappaB and c-jun activity in male T lymphocytes, resulting in higher production of interferon gamma and tumor necrosis factor (but not interleukin 17), and lower production of T helper (Th)2 cytokines. Upon induction of experimental autoimmune encephalomyelitis, male but not female PPARalpha(-/-) mice developed more severe clinical signs that were restricted to the acute phase of disease. These results suggest that males are less prone to develop Th1-mediated autoimmunity because they have higher T cell expression of PPARalpha.
Figures

Similar articles
-
Licensing of myeloid cells promotes central nervous system autoimmunity and is controlled by peroxisome proliferator-activated receptor γ.Brain. 2012 May;135(Pt 5):1586-605. doi: 10.1093/brain/aws058. Epub 2012 Mar 24. Brain. 2012. PMID: 22447120
-
Peroxisome proliferator-activated receptor (PPAR)α and -γ regulate IFNγ and IL-17A production by human T cells in a sex-specific way.Proc Natl Acad Sci U S A. 2012 Jun 12;109(24):9505-10. doi: 10.1073/pnas.1118458109. Epub 2012 May 30. Proc Natl Acad Sci U S A. 2012. PMID: 22647601 Free PMC article.
-
Peroxisome proliferator-activated receptor gamma is required for CD4+ T cell-mediated lymphopenia-associated autoimmunity.J Immunol. 2011 Oct 15;187(8):4161-9. doi: 10.4049/jimmunol.1101731. Epub 2011 Sep 9. J Immunol. 2011. PMID: 21908737 Free PMC article.
-
Antagonizing Peroxisome Proliferator-Activated Receptor α Activity Selectively Enhances Th1 Immunity in Male Mice.J Immunol. 2015 Dec 1;195(11):5189-202. doi: 10.4049/jimmunol.1500449. Epub 2015 Oct 21. J Immunol. 2015. PMID: 26491197
-
Role of Th17 cells in the pathogenesis of CNS inflammatory demyelination.J Neurol Sci. 2013 Oct 15;333(1-2):76-87. doi: 10.1016/j.jns.2013.03.002. Epub 2013 Apr 8. J Neurol Sci. 2013. PMID: 23578791 Free PMC article. Review.
Cited by
-
Resistance training and pioglitazone lead to improvements in muscle power during voluntary weight loss in older adults.J Gerontol A Biol Sci Med Sci. 2013 Jul;68(7):828-36. doi: 10.1093/gerona/gls258. Epub 2013 Jan 4. J Gerontol A Biol Sci Med Sci. 2013. PMID: 23292287 Free PMC article. Clinical Trial.
-
The Effects of Androgens on T Cells: Clues to Female Predominance in Autoimmune Liver Diseases?Front Immunol. 2020 Jul 29;11:1567. doi: 10.3389/fimmu.2020.01567. eCollection 2020. Front Immunol. 2020. PMID: 32849531 Free PMC article. Review.
-
Liver X receptor and peroxisome proliferator-activated receptor as integrators of lipid homeostasis and immunity.Immunol Rev. 2012 Sep;249(1):72-83. doi: 10.1111/j.1600-065X.2012.01153.x. Immunol Rev. 2012. PMID: 22889216 Free PMC article. Review.
-
Cord blood leptin levels of healthy neonates are associated with IFN-γ production by cord blood T-cells.PLoS One. 2012;7(7):e40830. doi: 10.1371/journal.pone.0040830. Epub 2012 Jul 16. PLoS One. 2012. PMID: 22815836 Free PMC article.
-
PPARs and the Development of Type 1 Diabetes.PPAR Res. 2020 Jan 9;2020:6198628. doi: 10.1155/2020/6198628. eCollection 2020. PPAR Res. 2020. PMID: 32395123 Free PMC article. Review.
References
-
- Steinman, L. 1996. Multiple sclerosis: a coordinated immunological attack against myelin in the central nervous system. Cell. 85:299–302. - PubMed
-
- Noseworthy, J.H., C. Lucchinetti, M. Rodriguez, and B.G. Weinshenker. 2000. Multiple sclerosis. N. Engl. J. Med. 343:938–952. - PubMed
-
- Lock, C., G. Hermans, R. Pedotti, A. Brendolan, E. Schadt, H. Garren, A. Langer-Gould, S. Strober, B. Cannella, J. Allard, et al. 2002. Gene microarray analysis of multiple sclerosis lesions yields new targets validated in autoimmune encephalomyelitis. Nat. Med. 8:500–508. - PubMed
-
- Komiyama, Y., S. Nakae, T. Matsuki, A. Nambu, H. Ishigame, S. Kakuta, K. Sudo, and Y. Iwakura. 2006. IL-17 plays an important role in the development of experimental autoimmune encephalomyelitis. J. Immunol. 177:566–573. - PubMed
Publication types
MeSH terms
Substances
Grants and funding
LinkOut - more resources
Full Text Sources
Other Literature Sources
Molecular Biology Databases
Research Materials
Miscellaneous
