

Recombination and the nature of bacterial speciation
- PMID: 17255503
- PMCID: PMC2220085
- DOI: 10.1126/science.1127573
Recombination and the nature of bacterial speciation
Abstract
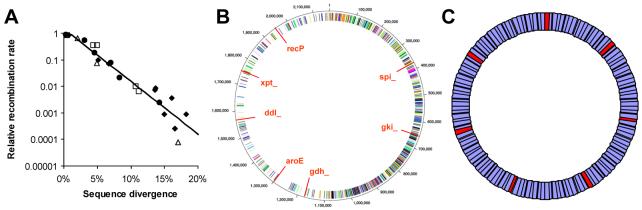
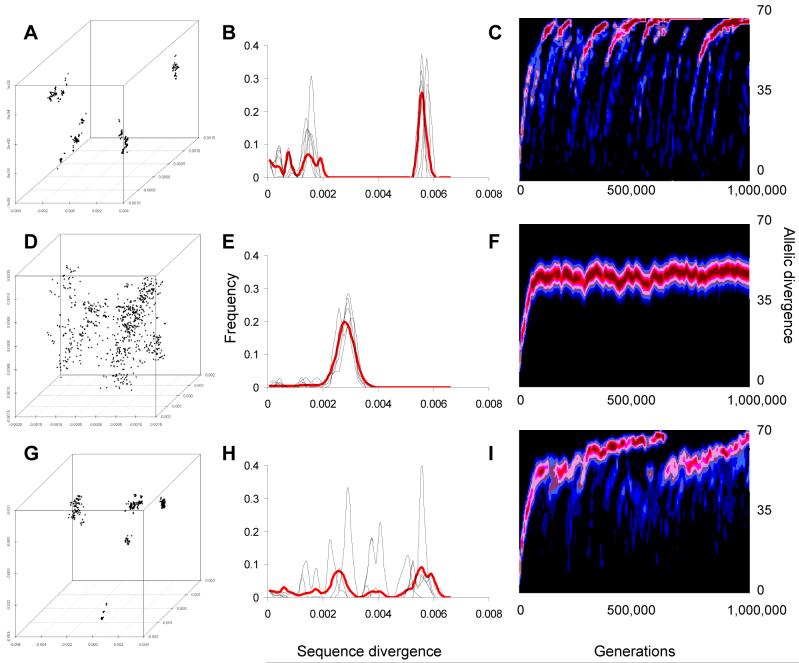
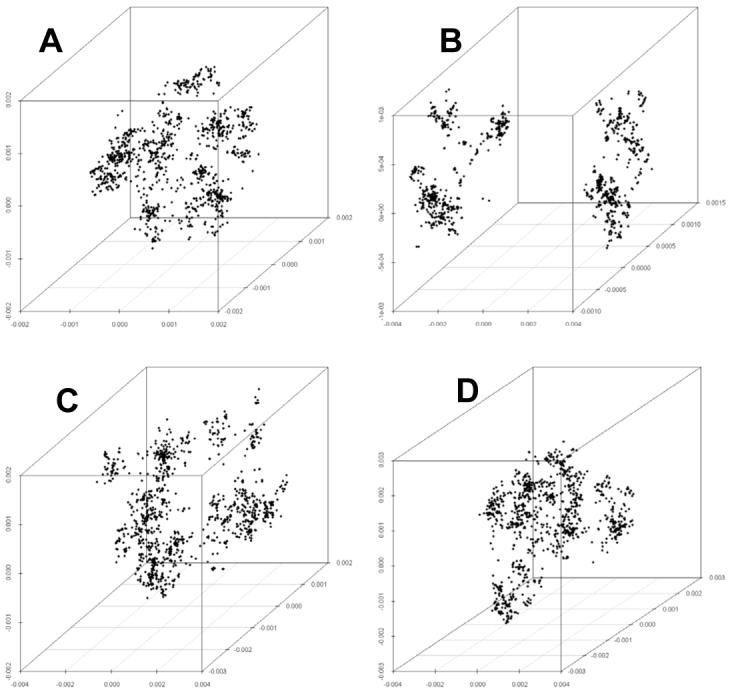
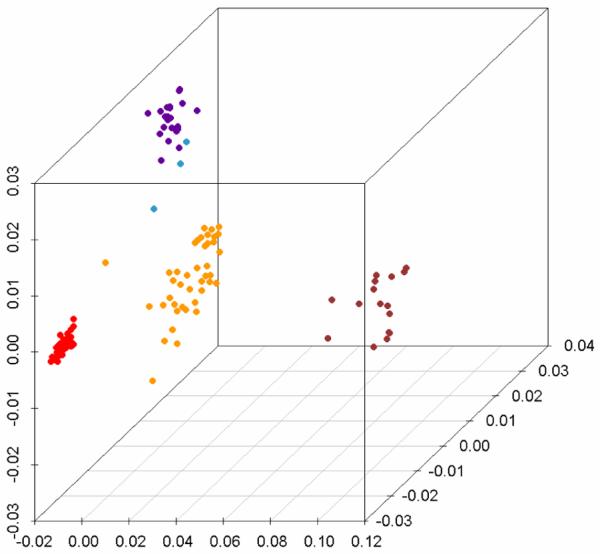
Genetic surveys reveal the diversity of bacteria and lead to the questioning of species concepts used to categorize bacteria. One difficulty in defining bacterial species arises from the high rates of recombination that results in the transfer of DNA between relatively distantly related bacteria. Barriers to this process, which could be used to define species naturally, are not apparent. Here, we review conceptual models of bacterial speciation and describe our computer simulations of speciation. Our findings suggest that the rate of recombination and its relation to genetic divergence have a strong influence on outcomes. We propose that a distinction be made between clonal divergence and sexual speciation. Hence, to make sense of bacterial diversity, we need data not only from genetic surveys but also from experimental determination of selection pressures and recombination rates and from theoretical models.
Figures
Similar articles
-
Modelling bacterial speciation.Philos Trans R Soc Lond B Biol Sci. 2006 Nov 29;361(1475):2039-44. doi: 10.1098/rstb.2006.1926. Philos Trans R Soc Lond B Biol Sci. 2006. PMID: 17062418 Free PMC article.
-
The bacterial species challenge: making sense of genetic and ecological diversity.Science. 2009 Feb 6;323(5915):741-6. doi: 10.1126/science.1159388. Science. 2009. PMID: 19197054 Review.
-
Speciation trajectories in recombining bacterial species.PLoS Comput Biol. 2017 Jul 3;13(7):e1005640. doi: 10.1371/journal.pcbi.1005640. eCollection 2017 Jul. PLoS Comput Biol. 2017. PMID: 28671999 Free PMC article.
-
Homologous recombination in Agrobacterium: potential implications for the genomic species concept in bacteria.Mol Biol Evol. 2009 Jan;26(1):167-76. doi: 10.1093/molbev/msn236. Epub 2008 Oct 20. Mol Biol Evol. 2009. PMID: 18936442
-
The interplay of homologous recombination and horizontal gene transfer in bacterial speciation.Methods Mol Biol. 2009;532:29-53. doi: 10.1007/978-1-60327-853-9_3. Methods Mol Biol. 2009. PMID: 19271178 Review.
Cited by
-
Analysis of genome content evolution in pvc bacterial super-phylum: assessment of candidate genes associated with cellular organization and lifestyle.Genome Biol Evol. 2012;4(12):1375-90. doi: 10.1093/gbe/evs113. Genome Biol Evol. 2012. PMID: 23221607 Free PMC article.
-
Horizontal gene transfer, dispersal and haloarchaeal speciation.Life (Basel). 2015 May 19;5(2):1405-26. doi: 10.3390/life5021405. Life (Basel). 2015. PMID: 25997110 Free PMC article. Review.
-
A genomic view of experimental intraspecies and interspecies transformation of a rifampicin-resistance allele into Neisseria meningitidis.Microb Genom. 2018 Nov;4(11):e000222. doi: 10.1099/mgen.0.000222. Epub 2018 Sep 25. Microb Genom. 2018. PMID: 30251949 Free PMC article.
-
Recombination of ecologically and evolutionarily significant loci maintains genetic cohesion in the Pseudomonas syringae species complex.Genome Biol. 2019 Jan 3;20(1):3. doi: 10.1186/s13059-018-1606-y. Genome Biol. 2019. PMID: 30606234 Free PMC article.
-
Bacillus subtilis RecA interacts with and loads RadA/Sms to unwind recombination intermediates during natural chromosomal transformation.Nucleic Acids Res. 2019 Sep 26;47(17):9198-9215. doi: 10.1093/nar/gkz647. Nucleic Acids Res. 2019. PMID: 31350886 Free PMC article.
References
Publication types
MeSH terms
Grants and funding
LinkOut - more resources
Full Text Sources
Other Literature Sources
