Sharpened cochlear tuning in a mouse with a genetically modified tectorial membrane
- PMID: 17220887
- PMCID: PMC3388746
- DOI: 10.1038/nn1828
Sharpened cochlear tuning in a mouse with a genetically modified tectorial membrane
Erratum in
-
Author Correction: Sharpened cochlear tuning in a mouse with a genetically modified tectorial membrane.Nat Neurosci. 2024 Aug;27(8):1633. doi: 10.1038/s41593-024-01727-y. Nat Neurosci. 2024. PMID: 39048790 No abstract available.
Abstract
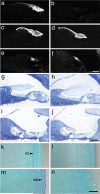
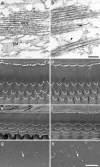
Frequency tuning in the cochlea is determined by the passive mechanical properties of the basilar membrane and active feedback from the outer hair cells, sensory-effector cells that detect and amplify sound-induced basilar membrane motions. The sensory hair bundles of the outer hair cells are imbedded in the tectorial membrane, a sheet of extracellular matrix that overlies the cochlea's sensory epithelium. The tectorial membrane contains radially organized collagen fibrils that are imbedded in an unusual striated-sheet matrix formed by two glycoproteins, alpha-tectorin (Tecta) and beta-tectorin (Tectb). In Tectb(-/-) mice the structure of the striated-sheet matrix is disrupted. Although these mice have a low-frequency hearing loss, basilar-membrane and neural tuning are both significantly enhanced in the high-frequency regions of the cochlea, with little loss in sensitivity. These findings can be attributed to a reduction in the acting mass of the tectorial membrane and reveal a new function for this structure in controlling interactions along the cochlea.
Figures


Similar articles
-
A targeted deletion in alpha-tectorin reveals that the tectorial membrane is required for the gain and timing of cochlear feedback.Neuron. 2000 Oct;28(1):273-85. doi: 10.1016/s0896-6273(00)00102-1. Neuron. 2000. PMID: 11087000
-
A deafness mutation isolates a second role for the tectorial membrane in hearing.Nat Neurosci. 2005 Aug;8(8):1035-42. doi: 10.1038/nn1496. Epub 2005 Jul 3. Nat Neurosci. 2005. PMID: 15995703
-
MET currents and otoacoustic emissions from mice with a detached tectorial membrane indicate the extracellular matrix regulates Ca2+ near stereocilia.J Physiol. 2021 Apr;599(7):2015-2036. doi: 10.1113/JP280905. Epub 2021 Mar 9. J Physiol. 2021. PMID: 33559882 Free PMC article.
-
The tectorial membrane: one slice of a complex cochlear sandwich.Curr Opin Otolaryngol Head Neck Surg. 2008 Oct;16(5):458-64. doi: 10.1097/MOO.0b013e32830e20c4. Curr Opin Otolaryngol Head Neck Surg. 2008. PMID: 18797289 Free PMC article. Review.
-
Auditory mechanics of the tectorial membrane and the cochlear spiral.Curr Opin Otolaryngol Head Neck Surg. 2011 Oct;19(5):382-7. doi: 10.1097/MOO.0b013e32834a5bc9. Curr Opin Otolaryngol Head Neck Surg. 2011. PMID: 21785353 Free PMC article. Review.
Cited by
-
Manipulation of the Endocochlear Potential Reveals Two Distinct Types of Cochlear Nonlinearity.Biophys J. 2020 Nov 17;119(10):2087-2101. doi: 10.1016/j.bpj.2020.10.005. Epub 2020 Oct 20. Biophys J. 2020. PMID: 33091378 Free PMC article.
-
The impact of targeted ablation of one row of outer hair cells and Deiters' cells on cochlear amplification.J Neurophysiol. 2022 Nov 1;128(5):1365-1373. doi: 10.1152/jn.00501.2021. Epub 2022 Oct 19. J Neurophysiol. 2022. PMID: 36259670 Free PMC article.
-
Somatic motility and hair bundle mechanics, are both necessary for cochlear amplification?Hear Res. 2011 Mar;273(1-2):109-22. doi: 10.1016/j.heares.2010.03.094. Epub 2010 Apr 27. Hear Res. 2011. PMID: 20430075 Free PMC article.
-
Porosity controls spread of excitation in tectorial membrane traveling waves.Biophys J. 2014 Mar 18;106(6):1406-13. doi: 10.1016/j.bpj.2014.02.012. Biophys J. 2014. PMID: 24655516 Free PMC article.
-
Basilar membrane velocity in a cochlea with a modified organ of Corti.Biophys J. 2011 Feb 16;100(4):858-67. doi: 10.1016/j.bpj.2011.01.006. Biophys J. 2011. PMID: 21320429 Free PMC article.
References
-
- von Bekesy G. Experiments in Hearing. McGraw-Hill; New York: 1960.
-
- Geisler CD. From Sound to Synapse. Oxford Univ. Press; Oxford: 1998.
-
- Goodyear RJ, Richardson GP. Extracellular matrices associated with the apical surfaces of sensory epithelia in the inner ear: molecular and structural diversity. J Neurobiol. 2002;53:211–227. - PubMed
-
- Dallos P. Overview, Cochlear Neurobiology. In: Dallos P, Popper AN, Fay RR, editors. The cochlea. Springer; 1996. pp. 1–43.
Publication types
MeSH terms
Substances
Grants and funding
LinkOut - more resources
Full Text Sources
Molecular Biology Databases

