

HEDGEHOG-GLI1 signaling regulates human glioma growth, cancer stem cell self-renewal, and tumorigenicity
- PMID: 17196391
- PMCID: PMC1855204
- DOI: 10.1016/j.cub.2006.11.033
HEDGEHOG-GLI1 signaling regulates human glioma growth, cancer stem cell self-renewal, and tumorigenicity
Erratum in
- Curr Biol. 2007 Jan 23;17(2):192
Abstract
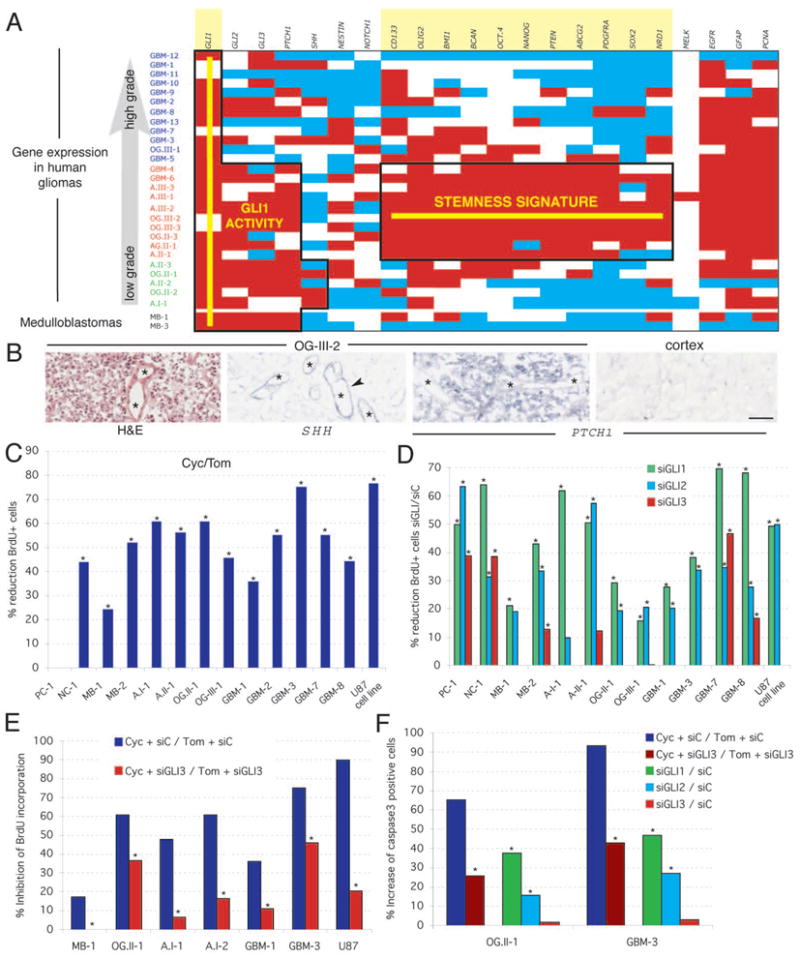
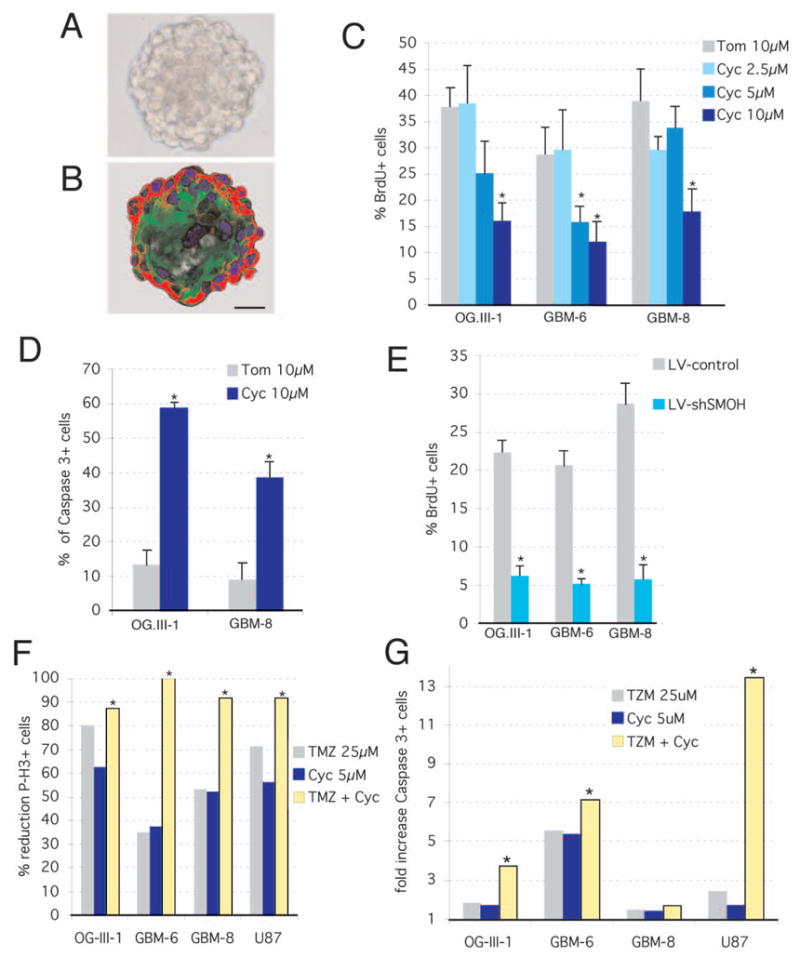
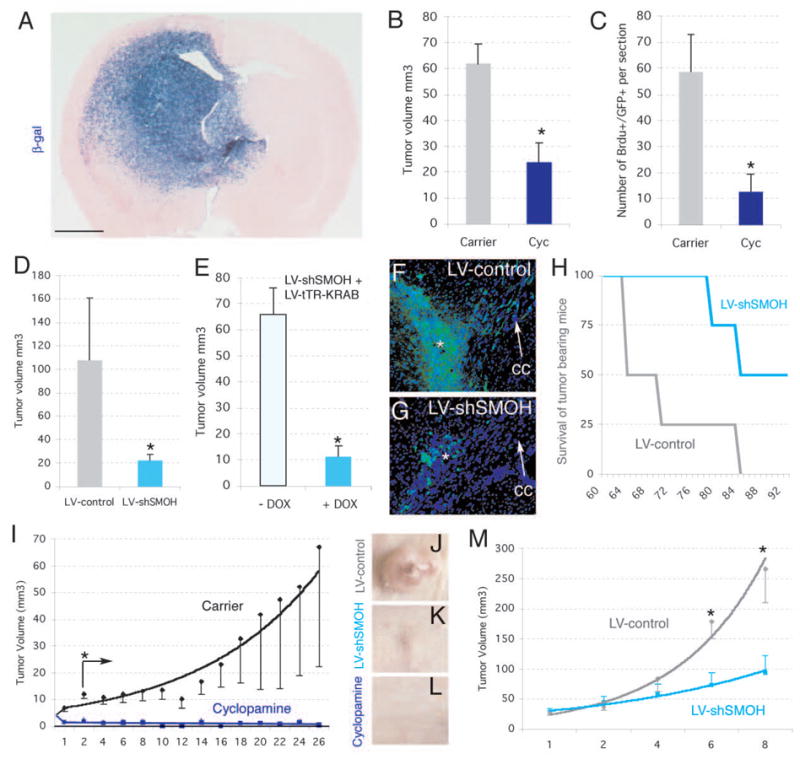
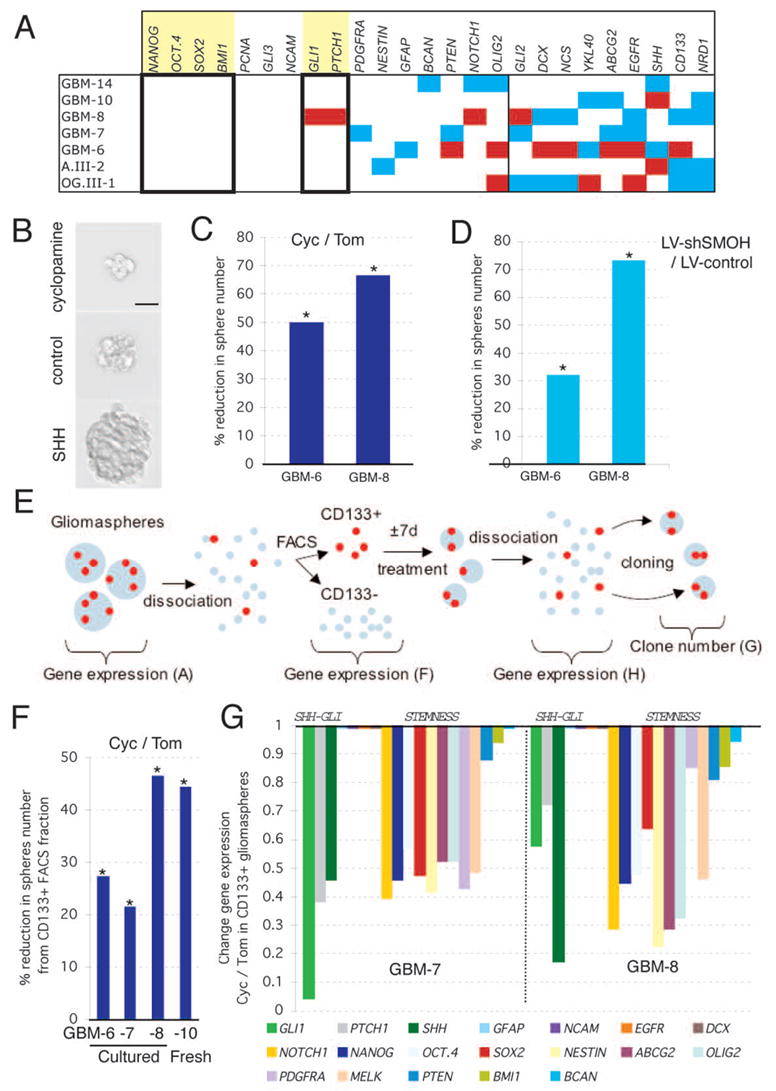
Cancer stem cells are rare tumor cells characterized by their ability to self-renew and to induce tumorigenesis. They are present in gliomas and may be responsible for the lethality of these incurable brain tumors. In the most aggressive and invasive type, glioblastoma multiforme (GBM), an average of about one year spans the period between detection and death [1]. The resistence of gliomas to current therapies may be related to the existence of cancer stem cells [2-6]. We find that human gliomas display a stemness signature and demonstrate that HEDGEHOG (HH)-GLI signaling regulates the expression of stemness genes in and the self-renewal of CD133(+) glioma cancer stem cells. HH-GLI signaling is also required for sustained glioma growth and survival. It displays additive and synergistic effects with temozolomide (TMZ), the current chemotherapeutic agent of choice. TMZ, however, does not block glioma stem cell self-renewal. Finally, interference of HH-GLI signaling with cyclopamine or through lentiviral-mediated silencing demonstrates that the tumorigenicity of human gliomas in mice requires an active pathway. Our results reveal the essential role of HH-GLI signaling in controlling the behavior of human glioma cancer stem cells and offer new therapeutic possibilities.
Figures
Similar articles
-
Essential role of Gli proteins in glioblastoma multiforme.Curr Protein Pept Sci. 2013 Mar;14(2):133-40. doi: 10.2174/1389203711314020005. Curr Protein Pept Sci. 2013. PMID: 23544423 Review.
-
Hedgehog-GLI signaling drives self-renewal and tumorigenicity of human melanoma-initiating cells.Stem Cells. 2012 Sep;30(9):1808-18. doi: 10.1002/stem.1160. Stem Cells. 2012. PMID: 22730244
-
QKI deficiency maintains glioma stem cell stemness by activating the SHH/GLI1 signaling pathway.Cell Oncol (Dordr). 2019 Dec;42(6):801-813. doi: 10.1007/s13402-019-00463-x. Epub 2019 Jul 10. Cell Oncol (Dordr). 2019. PMID: 31292920
-
NANOG regulates glioma stem cells and is essential in vivo acting in a cross-functional network with GLI1 and p53.EMBO J. 2010 Aug 4;29(15):2659-74. doi: 10.1038/emboj.2010.137. Epub 2010 Jun 25. EMBO J. 2010. PMID: 20581802 Free PMC article.
-
Brain as a paradigm of organ growth: Hedgehog-Gli signaling in neural stem cells and brain tumors.J Neurobiol. 2005 Sep 15;64(4):476-90. doi: 10.1002/neu.20160. J Neurobiol. 2005. PMID: 16041742 Review.
Cited by
-
Non-coding RNAs and glioma: Focus on cancer stem cells.Mol Ther Oncolytics. 2022 Sep 17;27:100-123. doi: 10.1016/j.omto.2022.09.005. eCollection 2022 Dec 15. Mol Ther Oncolytics. 2022. PMID: 36321132 Free PMC article. Review.
-
The use of hedgehog antagonists in cancer therapy: a comparison of clinical outcomes and gene expression analyses.Cancer Biol Ther. 2020 Oct 2;21(10):873-883. doi: 10.1080/15384047.2020.1806640. Epub 2020 Sep 11. Cancer Biol Ther. 2020. PMID: 32914706 Free PMC article.
-
Expression of glioma-associated oncogene homolog 1 is associated with invasion and postoperative liver metastasis in colon cancer.Int J Med Sci. 2012;9(5):334-8. doi: 10.7150/ijms.4553. Epub 2012 Jun 21. Int J Med Sci. 2012. PMID: 22745574 Free PMC article.
-
The implications of cancer stem cells for cancer therapy.Int J Mol Sci. 2012 Dec 5;13(12):16636-57. doi: 10.3390/ijms131216636. Int J Mol Sci. 2012. PMID: 23443123 Free PMC article. Review.
-
Hitting Them Where They Live: Targeting the Glioblastoma Perivascular Stem Cell Niche.Curr Pathobiol Rep. 2013 Jun 1;1(2):101-110. doi: 10.1007/s40139-013-0012-0. Curr Pathobiol Rep. 2013. PMID: 23766946 Free PMC article.
References
-
- Reardon DA, Rich JN, Friedman HS, Bigner DD. Recent advances in the treatment of malignant astrocytoma. J Clin Oncol. 2006;24:1253–1265. - PubMed
-
- Ignatova TN, Kukekov VG, Laywell ED, Suslov ON, Vrionis FD, Steindler DA. Human cortical glial tumors contain neural stem-like cells expressing astroglial and neuronal markers in vitro. Glia. 2002;39:193–206. - PubMed
-
- Singh SK, Clarke ID, Terasaki M, Bonn VE, Hawkins C, Squire J, Dirks PB. Identification of a cancer stem cell in human brain tumors. Cancer Res. 2003;63:5821–5828. - PubMed
-
- Singh SK, Hawkins C, Clarke ID, Squire JA, Bayani J, Hide T, Henkelman RM, Cusimano MD, Dirks PB. Identification of human brain tumour initiating cells. Nature. 2004;432:396–401. - PubMed
Publication types
MeSH terms
Substances
Grants and funding
LinkOut - more resources
Full Text Sources
Other Literature Sources
Medical
Research Materials
