Comparative Study
. 2006 Dec 27;26(52):13493-504.
doi: 10.1523/JNEUROSCI.3519-06.2006.

Synaptotagmin-2 is essential for survival and contributes to Ca2+ triggering of neurotransmitter release in central and neuromuscular synapses

Affiliations
Comparative Study

Synaptotagmin-2 is essential for survival and contributes to Ca2+ triggering of neurotransmitter release in central and neuromuscular synapses

Zhiping P Pang et al. J Neurosci. .

Abstract

Biochemical and genetic data suggest that synaptotagmin-2 functions as a Ca2+ sensor for fast neurotransmitter release in caudal brain regions, but animals and/or synapses lacking synaptotagmin-2 have not been examined. We have now generated mice in which the 5' end of the synaptotagmin-2 gene was replaced by lacZ. Using beta-galactosidase as a marker, we show that, consistent with previous studies, synaptotagmin-2 is widely expressed in spinal cord, brainstem, and cerebellum, but is additionally present in selected forebrain neurons, including most striatal neurons and some hypothalamic, cortical, and hippocampal neurons. Synaptotagmin-2-deficient mice were indistinguishable from wild-type littermates at birth, but subsequently developed severe motor dysfunction, and perished at approximately 3 weeks of age. Electrophysiological studies in cultured striatal neurons revealed that the synaptotagmin-2 deletion slowed the kinetics of evoked neurotransmitter release without altering the total amount of release. In contrast, synaptotagmin-2-deficient neuromuscular junctions (NMJs) suffered from a large reduction in evoked release and changes in short-term synaptic plasticity. Furthermore, in mutant NMJs, the frequency of spontaneous miniature release events was increased both at rest and during stimulus trains. Viewed together, our results demonstrate that the synaptotagmin-2 deficiency causes a lethal impairment in synaptic transmission in selected synapses. This impairment, however, is less severe than that produced in forebrain neurons by deletion of synaptotagmin-1, presumably because at least in NMJs, synaptotagmin-1 is coexpressed with synaptotagmin-2, and both together mediate fast Ca2+-triggered release. Thus, synaptotagmin-2 is an essential synaptotagmin isoform that functions in concert with other synaptotagmins in the Ca2+ triggering of neurotransmitter release.


Figures

Figure 1.
Figure 1.
Generation of synaptotagmin-2 KO mice by homologous recombination. A, Strategy for mutating synaptotagmin-2 in the mouse. The diagrams depict the structures of the wild-type synaptotagmin-2 gene, which contains all eight exons for synaptotagmin-2 (top), the targeting vector constructed for the mutation of the synaptotagmin-2 gene (middle), and the mutant gene resulting from homologous recombination (bottom). In the final product, part of exon 2 through exon 7 were replaced by the poliovirus IRES (IR), the cDNA for lacZ with a nuclear localization signal (lacZ) and PGK-Neo (Neo). This last gene was used for positive selection, whereas the MC1 thymidine kinase gene (TK) at the 3′ end of the construct was used for negative selection. The positions of the oligonucleotide primers used to identify the wild-type and mutant alleles are indicated by arrows (P1, P2, and P3). The SalI recognition sites (S) and template for the probe used for Southern blotting are also indicated. B, Western blots indicate the lack of synaptotagmin-2 in mutant mouse brain and spinal cord. Other synaptic proteins that were quantified (Table 1) in homogenate of brain, cerebellum/brainstem, and spinal cord homogenates are also showed in the figure. C, X-gal staining of whole-mount mouse CNS in WT and synaptotagmin-2 KO. Note that dorsal root ganglia attached to the spinal cord also show positive staining. Syt 2, Synaptotagmin-2; Syt 1, synaptotagmin-1; Syb 2, synaptobrevin-2; Syp 1, synaptophysin-1.
Figure 2.
Figure 2.
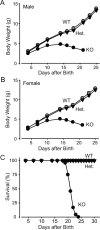
Weight and survival of synaptotagmin-2 KO mice. A, B, Body weight of littermate male (A) and female (B) wild-type and mutant mice as a function of age. Homozygous wild-type (WT), heterozygous mutant (Het), and homozygous mutant (KO) mice were examined (n = 10–21 for male and 10–41 for female animals in each genotype group; p < 0.05 at all ages for the KO mice compared with wild-type or heterozygous mice, which are not significantly different from each other). C, Survival of wild-type, synaptotagmin-2 heterozygous, and synaptotagmin-2 KO mice. All synaptotagmin-2 KO mice die between the ages of P19 and P24 (n = 35, 60, 24 for wild-type, heterozygous, and KO, respectively).
Figure 3.
Figure 3.
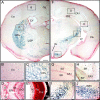
Expression pattern of synaptotagmin-2 in forebrain. β-Galactosidase activity is revealed by X-gal staining in synaptotagmin-2 KO homozygous mice. A, The majority of striatal neurons show β-galactosidase activity. B, C, Higher magnifications of brain areas indicated by dashed squares in A. D, No synaptotagmin-2 expression is found in olfactory bulb. E, Scattered neurons in retina showing β-galactosidase positivity. F, Very few neurons in cortex and hippocampus are β-galactosidase positive. G–J, Higher magnifications of brain areas indicated by dashed squares in F. 3V, Third ventricle; Cg, cingulate cortex; Ctx, cortex; CPu, caudate–putamen (striatum); DG, dentate gyrus; EPl, external plexiform layer of olfactory bulb; G, glomeruli; GC, ganglion cell layer; GrO, granular cell layer of olfactory bulb; INL, inner nuclear layer; LGP, lateral globus pallidus; LV, lateral ventricle; Mi, mitral cell layer of olfactory bulb; PEp, pigment epithelium; SO, stratum oriens; SR, stratum radiatum; R & C, layer of rods and cones; Rt, reticular thalamic nucleus; VMH, ventromedial hypothalamic nucleus; ZI, zona incerta. Scale bars: A, F, 50 μm; B–D, G–J, 5 μm; E, 2.5 μm.
Figure 4.
Figure 4.
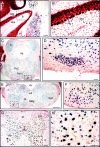
Expression pattern of synaptotagmin-2 in caudal brain. X-gal staining in synaptotagmin-2 KO homozygotes is shown. A, Cerebellum; C, E, brainstem; G, spinal cord. B, D, F, H, Higher magnifications of brain areas as indicated by dashed squares in A, C, E, and G. 4V, Fourth ventricle; 7N, facial nucleus; Aq, aqueduct; CC, central canal; DC, dorsal cochlear nucleus; df, dorsal fasciculus; DH, dorsal horn; Gi, gigantocellular reticular nucleus; Gr, granular layer; IC, inferior colliculus; Lat, lateral cerebellar nucleus; lf, lateral fasciculus; mlf, medial longitudinal fasciculus; Mol, molecular layer; PnC, caudal pontine reticular nucleus; PnV, ventral pontine reticular nucleus; Pkj, Purkinje cells; RMg, raphe magnus nucleus; Sp5, interpolar subnucleus of the spinal trigeminal nucleus; Tz, nucleus of trapezoid body; VH, ventral horn; WM, white matter. Scale bars: A, G, 10 μm; B, 2.5 μm; C, E, 50 μm; D, F, H, 5 μm.
Figure 5.
Figure 5.
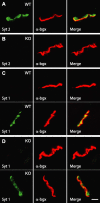
Immunostaining of synaptotagmin-1 and -2 in NMJ. A, All endplates express synaptotagmin-2 in wild-type (WT) NMJ. B, No synaptotagmin-2 was detected in synaptotagmin-2 KO NMJ. C, D, Synaptotagmin-1 was detected in some (bottom panel) but not other endplates (top panel) in both wild type and synaptotagmin-2 KO. Scale bar, 10 μm (applies to all subpanels). Abbreviations: Syt 1, Synaptotagmin-1; Syt 2, synaptotagmin-2; α-bgx, α-bungarotoxin.
Figure 6.
Figure 6.
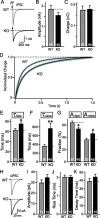
Synaptic release in striatal neuronal cultures. A, Representative traces of evoked IPSC in both WT and synaptotagmin-2 KO. AP, Action potential. Pooled data for both amplitude (B) and charge transfer over a time period of 1.5 s (C). D, Normalized average charge integration as a function of time over 1.5 s. WT, n = 16; KO, n = 17. The integrated charge transfer can be well fitted by a double exponential function (black solid line superimposed on to the integrated lines). The fitting gave out a fast decay (τfast) and slow decay (τslow). E, F, Pooled data indicate both τfast and τslow increased in synaptotagmin-2 KO striatal synapses. G, The fraction of the slow constituent (Aslow) increased in KO synapses, and fast constituent (Afast) decreased accordingly. Numbers of neurons recorded are indicated by numbers within each bar. H, Representative traces of sIPSCs in both WT and synaptotagmin-2 KO mice. There are no significant differences in average sIPSC amplitudes (I), 20–80% rise time (J), and 80–20% decay time (K). Events with amplitudes >150 pA, possibly attributable to spontaneous firing of presynaptic neurons, are excluded from analyses. Error bars indicate SEM. *p < 0.05; **p < 0.01.
Figure 7.
Figure 7.
Spontaneous miniature synaptic responses in NMJ. A, Representative traces of spontaneous mEPPs of WT and synaptotagmin-2 KO. B, Pooled data indicate a significant increase in the frequency of miniature synaptic release, whereas amplitude (C), rise slope (D), and rise time (E) show no differences in both WT and synaptotagmin-2 KO. F, In the presence of EGTA-AM (10 μm), a significant reduction of mEPP frequency is found in synaptotagmin-2 KO but not in WT NMJ. Frequency of mEPPs is still significantly higher compared with wild-type control in the presence of EGTA. The numbers of neurons recorded are indicated by the numbers above or within each bar. Error bars indicate SEM. **p < 0.01; ***p < 0.001.
Figure 8.
Figure 8.
Evoked synaptic responses in NMJ. A, Representative traces of phrenic nerve evoked EPP by a suction electrode in WT and synaptotagmin-2 KO. Maximum stimulus (2–6 V) intensities were used to evoke synaptic responses. B–D, Pooled data of the amplitude (B), quantal content (C), and speed of the EPP increase (D) in wild-type and synaptotagmin-2-deficient NMJs. The gray and black circles indicate individual evoked responses of each recording. The numbers of recordings are indicated in each bar. Error bars indicate SEM. **p < 0.01; ***p < 0.001.
Figure 9.
Figure 9.
Paired-pulse facilitation. A, Representative traces of paired-pulse stimuli induced synaptic responses in WT and synaptotagmin-2 KO NMJ. B, Paired-pulse ratio of evoked EPP when given two stimuli at different interstimulus intervals ranging from 20 to 100 ms. The numbers of recordings are indicated in parentheses. Error bars indicate SEM. **p < 0.01; ***p < 0.001.
Figure 10.
Figure 10.
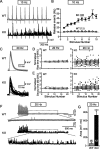
Short-term plasticity of evoked EPPs in NMJ. A, Representative traces of EPPs evoked by a 20 Hz stimulus train in WT and synaptotagmin-2 KO NMJs. B, C, Pooled data showing the absolute (B) and normalized amplitudes (C) of EPPs evoked at 20 Hz. Wild-type EPPs are larger (see Fig. 8B) and exhibit a moderate initial facilitation followed by depression. KO EPPs show facilitation. D, Normalized amplitudes of the steady-state EPPs as a function of stimulation frequency. Steady-state EPP amplitudes are the average of the last five responses during 1 s of train stimulation at 10, 20, and 50 Hz. Steady-state EPP values are the averages of the last five responses during the train of stimulation. The numbers of recordings are indicated in parentheses. Error bars indicate SEM. **p < 0.01.
Figure 11.
Figure 11.
Desynchronization of EPPs during high-frequency stimulus trains in synaptotagmin-2-deficient NMJs. A, Representative traces (superimposed 4 consecutive traces at 7 s interval) of WT and synaptotagmin-2 KO when given 10 Hz stimulation to the phrenic nerve. B, Frequency of individual release events during 10 Hz stimulus trains plotted as a function of the stimulus number. Synaptic events were counted manually. C, Superimposed individual responses after phrenic nerve stimulation at 20 Hz for 1 s. D, E, Distributions of rise time (10–90%) and decay time (80–20%) normalized to the first response plotted as a function of stimulus number (WT, n = 15; KO, n = 19). F, Representative traces of repetitive stimulation at 20 Hz for wild-type and synaptotagmin-2-deficient NMJs. The bottom traces represent enlargements of the traces for 3 s after 100 ms of the last stimulus. G, Integrated area under the peaks for 3 s after 50 ms of the last stimulus after a 1 s 20 Hz stimulus train. Integrated areas were plotted instead of event frequencies because the synaptotagmin-2-deficient NMJs have such high frequencies that they are impossible to accurately measure. The numbers of recordings are indicated above or within each bar. Error bars indicate SEM. ***p < 0.001.

Comment in

  • Synaptotagmin: is 2 better than 1?
    Leitzell K. Leitzell K. J Neurosci. 2007 Apr 18;27(16):4231-2. doi: 10.1523/JNEUROSCI.0668-07.2007. J Neurosci. 2007. PMID: 17442806 Free PMC article. Review. No abstract available.

Similar articles

Cited by

References

    1. Atluri PP, Regehr Delayed release of neurotransmitter from cerebellar granule cells. J Neurosci. 1998;18:8214–8227. - PMC - PubMed
    1. Baram D, Adachi R, Medalia O, Tuvim M, Dickey BF, Mekori YA, Sagi-Eisenberg R. Synaptotagmin II negatively regulates Ca2+-triggered exocytosis of lysosomes in mast cells. J Exp Med. 1999;189:1649–1658. - PMC - PubMed
    1. Barrett EF, Stevens CF. The kinetics of transmitter release at the frog neuromuscular junction. J Physiol (Lond) 1972;227:691–708. - PMC - PubMed
    1. Buffelli M, Burgess RW, Feng G, Lobe CG, Lichtman JW, Sanes JR. Genetic evidence that relative synaptic efficacy biases the outcome of synaptic competition. Nature. 2003;424:430–434. - PubMed
    1. Cruz LJ, Gray WR, Olivera BM, Zeikus RD, Kerr L, Yoshikami D, Moczydlowski E. Conus geographus toxins that discriminate between neuronal and muscle sodium channels. J Biol Chem. 1985;260:9280–9288. - PubMed

Publication types

MeSH terms