

Neuroanatomical phenotypes in the reeler mouse
- PMID: 17185001
- PMCID: PMC1945208
- DOI: 10.1016/j.neuroimage.2006.09.053
Neuroanatomical phenotypes in the reeler mouse
Abstract
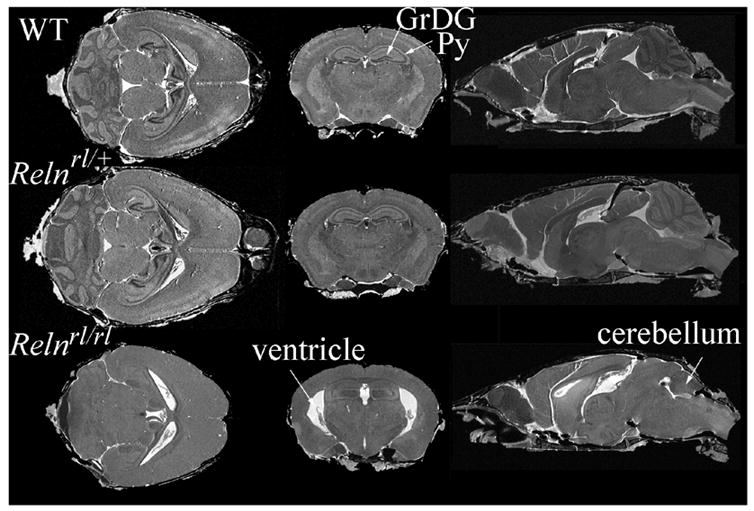
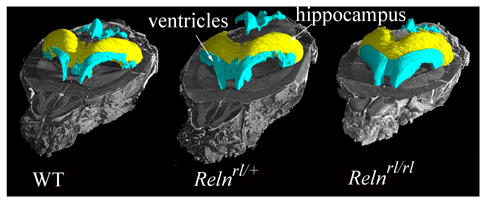
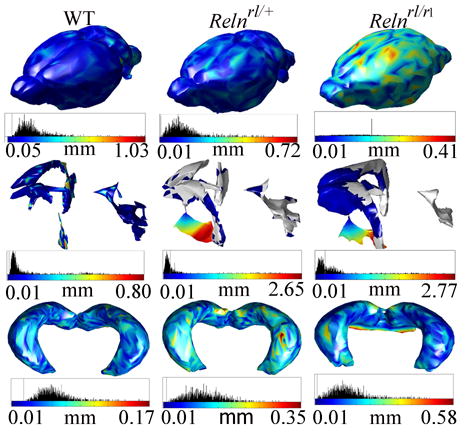
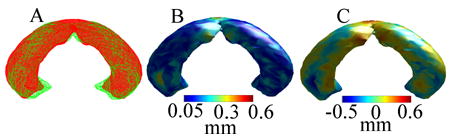
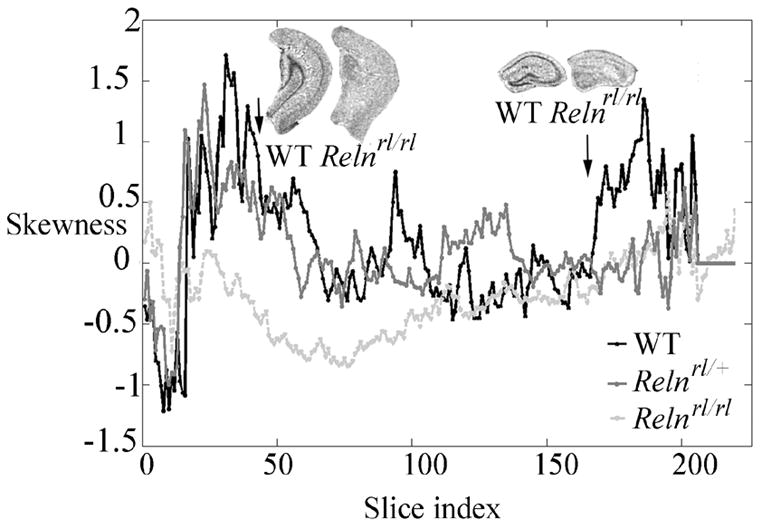
The reeler mouse (Reln) has been proposed as a neurodevelopmental model for certain neurological and psychiatric conditions and has been studied by qualitative histochemistry and electron microscopy. Using magnetic resonance microscopy (MRM), we have quantitated for the first time the neuromorphology of Reln mice at a resolution of 21.5 microm. The neuroanatomical phenotypes of heterozygous and homozygous mutant Reln mice were compared to those of wild type (WT) littermates using morphometry and texture analysis. The cortical, hippocampal, and cerebellar phenotypes of the heterozygous and homozygous mutant Reln mice were confirmed, and new features were revealed. The Reln(rl/rl) mice possessed a smaller brain, and both Reln(rl/+) and Reln(rl/rl) mice had increased ventricles compared to WT controls. Shape differences were found between WT and Reln(rl/rl) brains, specifically in cerebellum, olfactory bulbs, dorsomedial frontal and parietal cortex, certain regions of temporal and occipital lobes, as well as in the lateral ventricles and ventral hippocampus. These findings suggest that certain brain regions may be more severely impacted by the Reln mutation than others. Gadolinium-based active staining demonstrated that layers of the hippocampus were disorganized in Reln(rl/rl) mice and differences in thickness of these layers were identified between WT and Reln(rl/rl) mice. The intensity distributions characteristic to the dorsal, middle, and ventral hippocampus were altered in the Reln(rl/rl), especially in the ventral hippocampus. These differences were quantified using skewness and modeling the intensity distributions with a Gaussian mixture. Our results suggest that structural features of Reln(rl/rl) brain most closely phenocopy those of patients with Norman-Roberts lissencephaly.
Figures

Similar articles
-
Histological study in the brain of the reelin/Dab1-compound mutant mouse.Anat Sci Int. 2009 Sep;84(3):200-9. doi: 10.1007/s12565-008-0009-7. Epub 2009 Feb 17. Anat Sci Int. 2009. PMID: 19221860
-
Behavioral phenotype of the reeler mutant mouse: effects of RELN gene dosage and social isolation.Behav Neurosci. 2003 Dec;117(6):1257-75. doi: 10.1037/0735-7044.117.6.1257. Behav Neurosci. 2003. PMID: 14674845
-
Autosomal recessive lissencephaly with cerebellar hypoplasia is associated with human RELN mutations.Nat Genet. 2000 Sep;26(1):93-6. doi: 10.1038/79246. Nat Genet. 2000. PMID: 10973257
-
The Reeler Mouse: A Translational Model of Human Neurological Conditions, or Simply a Good Tool for Better Understanding Neurodevelopment?J Clin Med. 2019 Dec 1;8(12):2088. doi: 10.3390/jcm8122088. J Clin Med. 2019. PMID: 31805691 Free PMC article. Review.
-
[Cytoarchitectonic abnormality in the facial nucleus of the reeler mouse].Kaibogaku Zasshi. 1999 Aug;74(4):411-20. Kaibogaku Zasshi. 1999. PMID: 10496086 Review. Japanese.
Cited by
-
Herbal Formula Extract Ameliorates Anxiety and Cognitive Impairment via Regulation of the Reelin/Dab-1 Pathway in a Murine Model of Post-Traumatic Stress Disorder.Pharmaceutics. 2024 Aug 30;16(9):1150. doi: 10.3390/pharmaceutics16091150. Pharmaceutics. 2024. PMID: 39339187 Free PMC article.
-
Quantitative mouse brain phenotyping based on single and multispectral MR protocols.Neuroimage. 2012 Nov 15;63(3):1633-45. doi: 10.1016/j.neuroimage.2012.07.021. Epub 2012 Jul 23. Neuroimage. 2012. PMID: 22836174 Free PMC article.
-
On the Usage of Brain Atlases in Neuroimaging Research.Mol Imaging Biol. 2018 Oct;20(5):742-749. doi: 10.1007/s11307-018-1259-y. Mol Imaging Biol. 2018. PMID: 30094652 Review.
-
Manipulation of tissue contrast using contrast agents for enhanced MR microscopy in ex vivo mouse brain.Neuroimage. 2009 Jul 1;46(3):589-99. doi: 10.1016/j.neuroimage.2009.02.027. Epub 2009 Mar 2. Neuroimage. 2009. PMID: 19264139 Free PMC article.
-
Altered branching patterns of Purkinje cells in mouse model for cortical development disorder.Sci Rep. 2011;1:122. doi: 10.1038/srep00122. Epub 2011 Oct 18. Sci Rep. 2011. PMID: 22355639 Free PMC article.
References
-
- American Psychiatric Association. Text Revision (DSM-IV-TR) 4. Arlington, VA: American Psychiatric Association; 2000. Diagnostic and Statistical Manual of Mental Disorders.
-
- Arnold SE, Franz BR, Gur RC, Gur RE, Shapiro RM, Moberg PJ, Trojanowski JQ. Smaller neuron size in schizophrenia in hippocampal subfields that mediate cortical-hippocampal interactions. Am J Psychiatry. 1995;152:738–48. - PubMed
-
- Assadi AH, Zhang G, Beffert U, McNeil RS, Renfro AL, Niu S, Quattrocchi CC, Antalffy BA, Sheldon M, Armstrong DD, Wynshaw-Boris A, Herz J, D'Arcangelo G, Clark GD. Interaction of reelin signaling and Lis1 in brain development. Nat Genet. 2003;35:270–6. - PubMed
-
- Badea A, Kostopoulos GK, Ioannides AA. Surface visualization of electromagnetic brain activity. J Neurosci Methods. 2003;127:137–47. - PubMed
-
- Ballmaier M, Zoli M, Leo G, Agnati LF, Spano P. Preferential alterations in the mesolimbic dopamine pathway of heterozygous reeler mice: an emerging animal-based model of schizophrenia. Eur J Neurosci. 2002;15:1197–205. - PubMed
Publication types
MeSH terms
Grants and funding
LinkOut - more resources
Full Text Sources
Molecular Biology Databases
