. 2006 Dec 18;175(6):901-11.
doi: 10.1083/jcb.200608073.

Chaperone-mediated coupling of endoplasmic reticulum and mitochondrial Ca2+ channels

Affiliations

Chaperone-mediated coupling of endoplasmic reticulum and mitochondrial Ca2+ channels

György Szabadkai et al. J Cell Biol. .

Abstract

The voltage-dependent anion channel (VDAC) of the outer mitochondrial membrane mediates metabolic flow, Ca(2+), and cell death signaling between the endoplasmic reticulum (ER) and mitochondrial networks. We demonstrate that VDAC1 is physically linked to the endoplasmic reticulum Ca(2+)-release channel inositol 1,4,5-trisphosphate receptor (IP(3)R) through the molecular chaperone glucose-regulated protein 75 (grp75). Functional interaction between the channels was shown by the recombinant expression of the ligand-binding domain of the IP(3)R on the ER or mitochondrial surface, which directly enhanced Ca(2+) accumulation in mitochondria. Knockdown of grp75 abolished the stimulatory effect, highlighting chaperone-mediated conformational coupling between the IP(3)R and the mitochondrial Ca(2+) uptake machinery. Because organelle Ca(2+) homeostasis influences fundamentally cellular functions and death signaling, the central location of grp75 may represent an important control point of cell fate and pathogenesis.


Figures
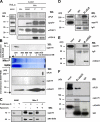
Figure 1.
Figure 1.
IP3R, VDAC1, and grp75 colocalize on the MAM fraction. (A) Protein components of subcellular fractions prepared from rat liver and HeLa cells revealed by immunoblot analysis. Mito, mitochondria; MAM, light mitochondrial fraction; P, heavy mitochondrial fraction, enriched in matrix components; C, crude mitochondrial fraction before Percoll gradient separation. 10 μg of proteins were loaded on 10% SDS-polyacrylamide gels. The presence of IP3Rs was shown by using a non–isotype-specific monoclonal antibody. VDAC1 and grp75 were both present in the MAM, whereas it was free of contamination from inner membrane (Cox-II) and matrix (MnSOD; C) proteins. Different preparations are separated by the dotted line. Blots are representative of more than five experiments. (B) Blue-native and SDS-PAGE 2D separation of the MAM fraction (below BN) and Mito P proteins (above BN; for preparation of native subcellular fractions, see Materials and methods and A). The native fractions were solubilized and separated on an acrylamide gradient gel in the first dimension. The capillary gel was stacked over a 10% SDS-polyacrylamide gel and separated, and the proteins were immunoblotted against the IP3Rs, grp75, and VDAC1. A typical result of an immunoblot from three separate experiments is shown. (C) The MAM and Mito P fractions (50 μg of proteins) were subjected to proteinase K digestion (50 μg/ml) and the presence of grp75 and MnSOD was revealed by immunoblotting. Hyposmotic shock (50 mM mannitol, 5 mM Hepes, and 0.1 mM EGTA for 30 min at room temperature) was applied to the Mito P fraction to induce release of matrix proteins. (D–F) Coimmunoprecipitation of grp75 with IP3R and VDAC1. Total cellular proteins were used for immunoprecipitation with a polyclonal IP3R1 (D), a polyclonal VDAC (E), and a monoclonal grp75 (F) antibody, and the precipitated protein fractions were separated on 10% SDS-polyacrylamide gels and immunoblotted against IP3Rs, grp75, and VDAC1. The input homogenate fractions, the IgG controls, and the immunoprecipitates are shown.
Figure 2.
Figure 2.
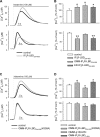
Effect of the IP3R ligand-binding domain on mitochondrial Ca2+ uptake. (A and C) HeLa cells were transfected with mitochondrially targeted (mtAEQmut; top) and cytosolic aequorin (bottom). Control traces are shown in black; traces from cells cotransfected with the IP3R-LBD224-605 (A) and the IP3R-LBD224-605 K508 mutant (C) are shown in gray. Traces are representative of >15 experiments from >5 preparations. (B) Effect of the cytosolic-, OMM-, and ER-targeted IP3R-LBD224-605 on peak mitochondrial and cytosolic Ca2+ responses (top and bottom, respectively). (D) Effect of the OMM-IP3R-LBD224-605 (K508A), the IP3-binding PH domain of the p130 PLC-like protein (OMM-p130-PH), and the OMM targeted N-terminal (1-604 aa) part of the IP3R (OMM-IP3R-LBD1-604), on mitochondrial (top) and cytoplasmic Ca2+ responses (bottom) after 100 μM histamine stimulation. Data in B and D were normalized to mean of the control group. Mean ± SEM of variation is shown as percentage. Cells were transfected, and [Ca2+] was measured as described in Materials and methods. Values are shown. *, P < 0.05; **, P < 0.01. For absolute values see Table S1, available at http://www.jcb.org/cgi/content/full/jcb.200608073/DC1.
Figure 3.
Figure 3.
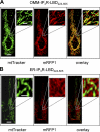
Intracellular localization of OMM- and ER-targeted IP3R-LBD224-605. Cells were transfected with OMM-IP3R-LBD224-605-mRFP1 (A) or ER-IP3R-LBD224-605-mRFP1 (B) and loaded with the mitochondrial dye MitoTracker Green. Images on the left show mitochondrial structure, middle images show images of IP3R-LBD224-605-mRFP1 fluorescence, and images on the right show colocalization of the green and red signals. Insets show magnified images of the mitochondrial and ER networks. Bars: (A and B) 10 μm; (insets) 2 μm.
Figure 4.
Figure 4.
The effect of IP3R-LBD224-605 on mitochondrial Ca2+ uptake after capacitative Ca2+ influx. [Ca2+]m and [Ca2+]c (top and bottom, respectively, in A and B) were measured in HeLa cells and transfected with mtAEQmut and cytAEQ, respectively. After ER depletion in Ca2+-free medium (100 μM KRB-EGTA; 4 min), Ca2+ influx was induced by the re-addition of 2 mM CaCl2 to the extracellular medium. (A) Representative traces of control (black traces) and OMM-IP3R-LBD224-605–cotransfected cells (gray traces) are shown. ([Ca2+]m peak in controls, 12.1 ± 2.11 μM; [Ca2+]m peak in OMM-IP3R-LBD224-605–expressing cells, 21.2 ± 4.00 μM; P = 0.05; [Ca2+]c peak in controls, 0.96 ± 0.04 μM; [Ca2+]c peak in OMM-IP3R-LBD224-605–expressing cells, 1.04 ± 0.03 μM). In B, data normalized to the mean ± the SEM of the control group are shown as percentages. For absolute values see Table S1. **, P < 0.01.
Figure 5.
Figure 5.
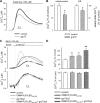
Coupling of the ER and mitochondrial Ca2+ channels depends on the presence of grp75. Mitochondrial Ca2+ uptake was measured in control siRNA–transfected HeLa cells (control); after siRNA-driven down-regulation of grp75 (siRNA-grp75); control siRNA and OMM-IP3R-LBD224-605–transfected cells; and siRNA-grp75 and OMM-IP3R-LBD224-605 cotransfected cells. Cells were also cotransfected with the mtAEQmut probe and mitochondrial Ca2+ response to 100 μM histamine was measured as described in the Materials and methods. Inset shows the effect of grp75 siRNA on grp75 levels after 24 h of transfection. Controls transfected only with Lipofectamine showed no difference in respect to control siRNA (not depicted). (B) Silencing of grp75 reverts the stimulatory effect of IP3R-LBD224-605 targeted both to the OMM and ER surface. The percent increase of [Ca2+]m peaks normalized to the mean of controls are shown in cells cotransfected with mtAEQmut and control siRNA (siRNA-grp75) and OMM-IP3R-LBD224-605 or ER-IP3R-LBD224-605 after stimulation with 100 μM histamine. The stimulatory effect of both the OMM- and ER-targeted IP3R-LBD224-605 was inhibited after the cotransfection with siRNA-grp75 (+), whereas the control Ca2+ peaks remained unaffected. Data normalized to the mean ± the SEM of the control group are shown in percentages. For absolute values see Table S1. *, P < 0.05; **, P < 0.01.
Figure 6.
Figure 6.
Effect of grp75 overexpression on mitochondrial Ca2+ responses and steady-state [Ca2+]er. (A and B) HeLa cells were cotransfected with mtAEQmut or erAEQmut probes (controls) and mouse grp75. [Ca2+]m was measured as described in Fig. 2, after stimulation with 100 μM histamine, as indicated in A. The percent variation (± SEM) of [Ca2+]m peaks normalized to the mean of controls are shown in B (left); the effect of grp75 on steady-state [Ca2+]er is shown on the right. Steady-state [Ca2+]er was measured after refilling of the ER in the presence of 1 mM CaCl2 in the extracellular medium (n = 10, from four separate experiments). Before measurements, erAEQmut-transfected cells were reconstituted with coelenterazine n, after ER Ca2+ depletion in a solution containing 0 [Ca2+], 600 μM EGTA, and 1 μM ionomycin, as previously described (Chiesa et al., 2001). For [Ca2+]m values see Table S1. [Ca2+]er in controls, 416 ± 19.3 μM; in grp75-overexpressing cells: 334 ± 13.6 μM; P < 0.05. *, P < 0.05. (C and D) [Ca2+]m (top) and [Ca2+]c (bottom) were measured in control and grp75cyt-expressing cells, after induction of capacitative Ca2+ influx, after ER depletion with tBHQ in Ca2+-free medium (100 μM KRB-EGTA; 4 min) and readdition of 2 mM CaCl2. Representative traces of controls, cells cotransfected with OMM-IP3R-LBD224-605, grp75cyt, or both are shown. The percent increase (± SEM) of [Ca2+]m peaks normalized to the mean of controls are shown in D. [Ca2+]m peak in controls, 9.7 ± 1.2 μM; in OMM-IP3R-LBD224-605–expressing cells, 13.0 ± 1.8 μM; grp75cyt-expressing cells, 13.2 ± 1.6 μM; OMM-IP3R-LBD224-605 /grp75cyt–expressing cells, 18.8 ± 2.48. *, P < 0.05; **, P < 0.01.

Similar articles

Cited by

References

    1. Bassik, M.C., L. Scorrano, S.A. Oakes, T. Pozzan, and S.J. Korsmeyer. 2004. Phosphorylation of BCL-2 regulates ER Ca(2+) homeostasis and apoptosis. EMBO J. 23:1207–1216. - PMC - PubMed
    1. Berridge, M.J., M.D. Bootman, and H.L. Roderick. 2003. Calcium signalling: dynamics, homeostasis and remodelling. Nat. Rev. Mol. Cell Biol. 4:517–529. - PubMed
    1. Boehning, D., and S.K. Joseph. 2000. Direct association of ligand-binding and pore domains in homo- and heterotetrameric inositol 1,4,5-trisphosphate receptors. EMBO J. 19:5450–5459. - PMC - PubMed
    1. Bosanac, I., T. Michikawa, and K. Mikoshiba. 2004. Structural insights into the regulatory mechanism of IP3 receptor. Biochim. Biophys. Acta. 1742:89–102. - PubMed
    1. Brough, D., M.J. Schell, and R.F. Irvine. 2005. Agonist-induced regulation of mitochondrial and endoplasmic reticulum motility. Biochem. J. 392:291–297. - PMC - PubMed

Publication types

MeSH terms