Acquisition of direct antiviral effector functions by CMV-specific CD4+ T lymphocytes with cellular maturation
- PMID: 17158960
- PMCID: PMC2118179
- DOI: 10.1084/jem.20052246
Acquisition of direct antiviral effector functions by CMV-specific CD4+ T lymphocytes with cellular maturation
Abstract
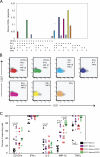
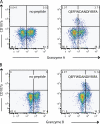
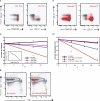
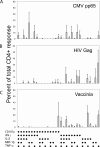
The role of CD4+ T cells in the control of persistent viral infections beyond the provision of cognate help remains unclear. We used polychromatic flow cytometry to evaluate the production of the cytokines interferon (IFN)-gamma, tumor necrosis factor (TNF)-alpha, and interleukin (IL)-2, the chemokine macrophage inflammatory protein (MIP)-1beta, and surface mobilization of the degranulation marker CD107a by CD4+ T cells in response to stimulation with cytomegalovirus (CMV)-specific major histocompatibility complex class II peptide epitopes. Surface expression of CD45RO, CD27, and CD57 on responding cells was used to classify CD4+ T cell maturation. The functional profile of virus-specific CD4+ T cells in chronic CMV infection was unique compared with that observed in other viral infections. Salient features of this profile were: (a) the simultaneous production of MIP-1beta, TNF-alpha, and IFN-gamma in the absence of IL-2; and (b) direct cytolytic activity associated with surface mobilization of CD107a and intracellular expression of perforin and granzymes. This polyfunctional profile was associated with a terminally differentiated phenotype that was not characterized by a distinct clonotypic composition. Thus, mature CMV-specific CD4+ T cells exhibit distinct functional properties reminiscent of antiviral CD8+ T lymphocytes.
Figures


Similar articles
-
Flow cytometric detection of degranulation reveals phenotypic heterogeneity of degranulating CMV-specific CD8+ T lymphocytes in rhesus macaques.J Immunol Methods. 2007 Aug 31;325(1-2):20-34. doi: 10.1016/j.jim.2007.05.011. Epub 2007 Jun 12. J Immunol Methods. 2007. PMID: 17628586 Free PMC article.
-
Ex vivo functional analysis, expansion and adoptive transfer of cytomegalovirus-specific T-cells in patients with glioblastoma multiforme.Immunol Cell Biol. 2012 Oct;90(9):872-80. doi: 10.1038/icb.2012.19. Epub 2012 Apr 17. Immunol Cell Biol. 2012. PMID: 22508289
-
Functional heterogeneity of cytokines and cytolytic effector molecules in human CD8+ T lymphocytes.J Immunol. 2001 Jul 1;167(1):181-7. doi: 10.4049/jimmunol.167.1.181. J Immunol. 2001. PMID: 11418647
-
CD57 in human natural killer cells and T-lymphocytes.Cancer Immunol Immunother. 2016 Apr;65(4):441-52. doi: 10.1007/s00262-016-1803-z. Epub 2016 Feb 5. Cancer Immunol Immunother. 2016. PMID: 26850637 Free PMC article. Review.
-
CD4 memory T cells: what are they and what can they do?Semin Immunol. 2009 Apr;21(2):53-61. doi: 10.1016/j.smim.2009.02.006. Epub 2009 Mar 9. Semin Immunol. 2009. PMID: 19269850 Free PMC article. Review.
Cited by
-
Selective expansion of polyfunctional pathogen-specific CD4(+) T cells in HIV-1-infected patients with immune reconstitution inflammatory syndrome.Blood. 2012 Mar 29;119(13):3105-12. doi: 10.1182/blood-2011-09-380840. Epub 2012 Jan 4. Blood. 2012. PMID: 22219223 Free PMC article.
-
Nef-specific CD45RA+ CD8+ T cells secreting MIP-1beta but not IFN-gamma are associated with nonprogressive HIV-1 infection.AIDS Res Ther. 2010 Jul 2;7:20. doi: 10.1186/1742-6405-7-20. AIDS Res Ther. 2010. PMID: 20598119 Free PMC article.
-
CD4 CTL: living up to the challenge.Semin Immunol. 2013 Nov 15;25(4):273-81. doi: 10.1016/j.smim.2013.10.022. Epub 2013 Nov 15. Semin Immunol. 2013. PMID: 24246226 Free PMC article. Review.
-
STAT3 regulates cytotoxicity of human CD57+ CD4+ T cells in blood and lymphoid follicles.Sci Rep. 2018 Feb 23;8(1):3529. doi: 10.1038/s41598-018-21389-8. Sci Rep. 2018. PMID: 29476109 Free PMC article.
-
Heterogeneous memory T cells in antiviral immunity and immunopathology.Viral Immunol. 2008 Jun;21(2):99-113. doi: 10.1089/vim.2008.0002. Viral Immunol. 2008. PMID: 18476772 Free PMC article. Review.
References
-
- Pass, R.F. 1985. Epidemiology and transmission of cytomegalovirus. J. Infect. Dis. 152:243–248. - PubMed
-
- Sissons, J.G., and A.J. Carmichael. 2002. Clinical aspects and management of cytomegalovirus infection. J. Infect. 44:78–83. - PubMed
-
- Looney, R.J., A. Falsey, D. Campbell, A. Torres, J. Kolassa, C. Brower, R. McCann, M. Menegus, K. McCormick, M. Frampton, et al. 1999. Role of cytomegalovirus in the T cell changes seen in elderly individuals. Clin. Immunol. 90:213–219. - PubMed
-
- Moss, P., and N. Khan. 2004. CD8(+) T-cell immunity to cytomegalovirus. Hum. Immunol. 65:456–464. - PubMed
Publication types
MeSH terms
Substances
Grants and funding
LinkOut - more resources
Full Text Sources
Other Literature Sources
Research Materials

