

Apparent cooperativity in the folding of multidomain proteins depends on the relative rates of folding of the constituent domains
- PMID: 17108086
- PMCID: PMC1636339
- DOI: 10.1073/pnas.0604580103
Apparent cooperativity in the folding of multidomain proteins depends on the relative rates of folding of the constituent domains
Abstract
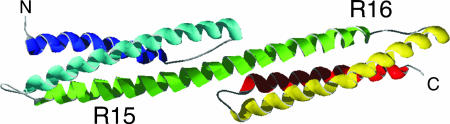
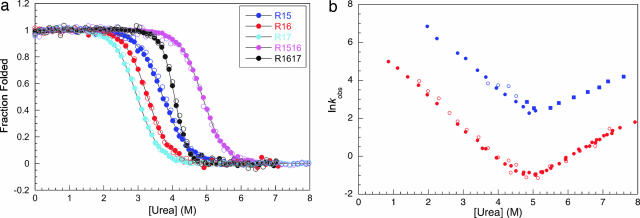
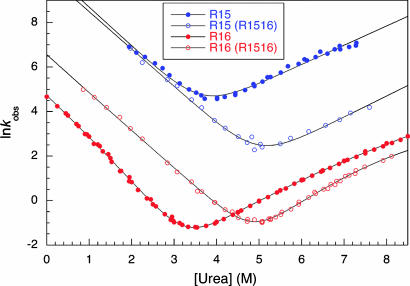
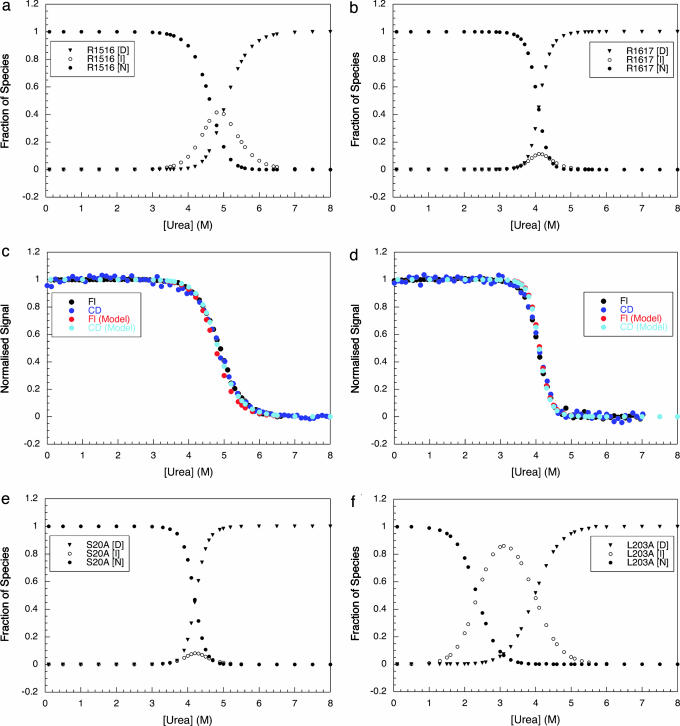
Approximately 75% of eukaryotic proteins contain more than one so-called independently folding domain. However, there have been relatively few systematic studies to investigate the effect of interdomain interactions on protein stability and fewer still on folding kinetics. We present the folding of pairs of three-helix bundle spectrin domains as a paradigm to indicate how complex such an analysis can be. Equilibrium studies show an increase in denaturant concentration required to unfold the domains with only a single unfolding transition; however, in some cases, this is not accompanied by the increase in m value, which would be expected if the protein is a truly cooperative, all-or-none system. We analyze the complex kinetics of spectrin domain pairs, both wild-type and carefully selected mutants. By comparing these pairs, we are able to demonstrate that equilibrium data alone are insufficient to describe the folding of multidomain proteins and to quantify the effects that one domain can have on its neighbor.
Conflict of interest statement
The authors declare no conflict of interest.
Figures


Similar articles
-
The folding pathway of a single domain in a multidomain protein is not affected by its neighbouring domain.J Mol Biol. 2008 Apr 25;378(2):297-301. doi: 10.1016/j.jmb.2008.02.032. Epub 2008 Feb 29. J Mol Biol. 2008. PMID: 18371978 Free PMC article.
-
Complex folding kinetics of a multidomain protein.Biophys J. 2006 Mar 15;90(6):2120-30. doi: 10.1529/biophysj.105.072710. Epub 2005 Dec 30. Biophys J. 2006. PMID: 16387757 Free PMC article.
-
Cooperativity, connectivity, and folding pathways of multidomain proteins.Proc Natl Acad Sci U S A. 2008 Sep 16;105(37):13865-70. doi: 10.1073/pnas.0804512105. Epub 2008 Sep 4. Proc Natl Acad Sci U S A. 2008. PMID: 18772375 Free PMC article.
-
The folding and evolution of multidomain proteins.Nat Rev Mol Cell Biol. 2007 Apr;8(4):319-30. doi: 10.1038/nrm2144. Epub 2007 Mar 14. Nat Rev Mol Cell Biol. 2007. PMID: 17356578 Review.
-
Analysis of Tandem Repeat Protein Folding Using Nearest-Neighbor Models.Annu Rev Biophys. 2021 May 6;50:245-265. doi: 10.1146/annurev-biophys-102220-083020. Epub 2021 Feb 19. Annu Rev Biophys. 2021. PMID: 33606943 Free PMC article. Review.
Cited by
-
The folding pathway of a single domain in a multidomain protein is not affected by its neighbouring domain.J Mol Biol. 2008 Apr 25;378(2):297-301. doi: 10.1016/j.jmb.2008.02.032. Epub 2008 Feb 29. J Mol Biol. 2008. PMID: 18371978 Free PMC article.
-
Disorder drives cooperative folding in a multidomain protein.Proc Natl Acad Sci U S A. 2016 Oct 18;113(42):11841-11846. doi: 10.1073/pnas.1608762113. Epub 2016 Oct 3. Proc Natl Acad Sci U S A. 2016. PMID: 27698144 Free PMC article.
-
Spontaneous refolding of the large multidomain protein malate synthase G proceeds through misfolding traps.J Biol Chem. 2018 Aug 24;293(34):13270-13283. doi: 10.1074/jbc.RA118.003903. Epub 2018 Jun 29. J Biol Chem. 2018. PMID: 29959230 Free PMC article.
-
Distinguishing specific and nonspecific interdomain interactions in multidomain proteins.Biophys J. 2008 Jan 15;94(2):622-8. doi: 10.1529/biophysj.107.119123. Epub 2007 Sep 21. Biophys J. 2008. PMID: 17890397 Free PMC article.
-
Studying the folding of multidomain proteins.HFSP J. 2008 Dec;2(6):365-77. doi: 10.2976/1.2991513. Epub 2008 Oct 15. HFSP J. 2008. PMID: 19436439 Free PMC article.
References
-
- Teichmann SA, Chothia C, Gerstein M. Curr Opin Struct Biol. 1999;9:390–399. - PubMed
-
- Jackson SE. Fold Des. 1998;3:R81–R91. - PubMed
-
- Zarnt T, Tradler T, Stoller G, Scholz C, Schmid FX, Fischer G. J Mol Biol. 1997;271:827–837. - PubMed
-
- Kirkitadze MD, Dryden DT, Kelly SM, Price NC, Wang X, Krych M, Atkinson JP, Barlow PN. FEBS Lett. 1999;459:133–138. - PubMed
-
- Kirkitadze MD, Krych M, Uhrin D, Dryden DT, Smith BO, Cooper A, Wang X, Hauhart R, Atkinson JP, Barlow PN. Biochemistry. 1999;38:7019–7031. - PubMed
Publication types
MeSH terms
Substances
Grants and funding
LinkOut - more resources
Full Text Sources
