Suppression of Arabidopsis vesicle-SNARE expression inhibited fusion of H2O2-containing vesicles with tonoplast and increased salt tolerance
- PMID: 17101982
- PMCID: PMC1693863
- DOI: 10.1073/pnas.0604421103
Suppression of Arabidopsis vesicle-SNARE expression inhibited fusion of H2O2-containing vesicles with tonoplast and increased salt tolerance
Abstract
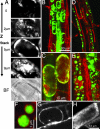
Intracellular vesicle trafficking performs essential functions in eukaryotic cells, such as membrane trafficking and delivery of molecules to their destinations. A major endocytotic route in plants is vesicle trafficking to the vacuole that plays an important role in plant salt tolerance. The final step in this pathway is mediated by the AtVAMP7C family of vesicle soluble N-ethylmaleimide-sensitive factor attachment protein receptors (v-SNAREs) that carry out the vesicle fusion with the tonoplast. Exposure to high-salt conditions causes immediate ionic and osmotic stresses, followed by production of reactive oxygen species. Here, we show that the reactive oxygen species are produced intracellularly, in endosomes that were targeted to the central vacuole. Suppression of the AtVAMP7C genes expression by antisense AtVAMP711 gene or in mutants of this family inhibited fusion of H2O2-containing vesicles with the tonoplast, which resulted in formation of H2O2-containing megavesicles that remained in the cytoplasm. The antisense and mutant plants exhibited improved vacuolar functions, such as maintenance of DeltapH, reduced release of calcium from the vacuole, and greatly improved plant salt tolerance. The antisense plants exhibited increased calcium-dependent protein kinase activity upon salt stress. Improved vacuolar ATPase activity during oxidative stress also was observed in a yeast system, in a DeltaVamp7 knockout strain. Interestingly, a microarray-based analysis of the AtVAMP7C genes showed a strong down-regulation of most genes in wild-type roots during salt stress, suggesting an evolutionary molecular adaptation of the vacuolar trafficking.
Conflict of interest statement
The authors declare no conflict of interest.
Figures


Similar articles
-
Reduced expression of the v-SNAREs AtVAMP71/AtVAMP7C gene family in Arabidopsis reduces drought tolerance by suppression of abscisic acid-dependent stomatal closure.J Exp Bot. 2010 Jun;61(10):2615-22. doi: 10.1093/jxb/erq099. Epub 2010 Apr 27. J Exp Bot. 2010. PMID: 20423938 Free PMC article.
-
Dynamic aspects of ion accumulation by vesicle traffic under salt stress in Arabidopsis.Plant Cell Physiol. 2009 Dec;50(12):2023-33. doi: 10.1093/pcp/pcp143. Plant Cell Physiol. 2009. PMID: 19880402
-
Distinct sets of tethering complexes, SNARE complexes, and Rab GTPases mediate membrane fusion at the vacuole in Arabidopsis.Proc Natl Acad Sci U S A. 2018 Mar 6;115(10):E2457-E2466. doi: 10.1073/pnas.1717839115. Epub 2018 Feb 20. Proc Natl Acad Sci U S A. 2018. PMID: 29463724 Free PMC article.
-
TRP Channel Trafficking.In: Liedtke WB, Heller S, editors. TRP Ion Channel Function in Sensory Transduction and Cellular Signaling Cascades. Boca Raton (FL): CRC Press/Taylor & Francis; 2007. Chapter 23. In: Liedtke WB, Heller S, editors. TRP Ion Channel Function in Sensory Transduction and Cellular Signaling Cascades. Boca Raton (FL): CRC Press/Taylor & Francis; 2007. Chapter 23. PMID: 21204515 Free Books & Documents. Review.
-
Plant vacuolar trafficking driven by RAB and SNARE proteins.Curr Opin Plant Biol. 2014 Dec;22:116-121. doi: 10.1016/j.pbi.2014.10.002. Curr Opin Plant Biol. 2014. PMID: 25460076 Review.
Cited by
-
The Arabidopsis R-SNARE VAMP721 Interacts with KAT1 and KC1 K+ Channels to Moderate K+ Current at the Plasma Membrane.Plant Cell. 2015 Jun;27(6):1697-717. doi: 10.1105/tpc.15.00305. Epub 2015 May 22. Plant Cell. 2015. PMID: 26002867 Free PMC article.
-
Plant defense mechanisms are activated during biotrophic and necrotrophic development of Colletotricum graminicola in maize.Plant Physiol. 2012 Mar;158(3):1342-58. doi: 10.1104/pp.111.190397. Epub 2012 Jan 12. Plant Physiol. 2012. PMID: 22247271 Free PMC article.
-
Loss of the Arabidopsis thaliana P₄-ATPase ALA3 reduces adaptability to temperature stresses and impairs vegetative, pollen, and ovule development.PLoS One. 2013 May 7;8(5):e62577. doi: 10.1371/journal.pone.0062577. Print 2013. PLoS One. 2013. PMID: 23667493 Free PMC article.
-
Ubiquitin-Specific Protease 2 (OsUBP2) Negatively Regulates Cell Death and Disease Resistance in Rice.Plants (Basel). 2022 Sep 29;11(19):2568. doi: 10.3390/plants11192568. Plants (Basel). 2022. PMID: 36235432 Free PMC article.
-
Soybean Trihelix transcription factors GmGT-2A and GmGT-2B improve plant tolerance to abiotic stresses in transgenic Arabidopsis.PLoS One. 2009 Sep 4;4(9):e6898. doi: 10.1371/journal.pone.0006898. PLoS One. 2009. Retraction in: PLoS One. 2023 Oct 9;18(10):e0292823. doi: 10.1371/journal.pone.0292823. PMID: 19730734 Free PMC article. Retracted.
References
-
- Uemura T, Ueda T, Ohniwa RL, Nakano A, Takeyasu K, Sato MH. Cell Struct Funct. 2004;29:49–65. - PubMed
-
- Bassham DC, Raikhel NV. Curr Opin Cell Biol. 2000;12:491–495. - PubMed
-
- Jurgens G. Annu Rev Cell Dev Biol. 2004;20:481–504. - PubMed
-
- Cavalli V, Vilbois F, Corti M, Marcote MJ, Tamura K, Karin M, Arkinstall S, Gruenberg J. Mol Cell. 2001;7:421–432. - PubMed
Publication types
MeSH terms
Substances
LinkOut - more resources
Full Text Sources
Other Literature Sources
Molecular Biology Databases

