

A bimodal pattern of relatedness between the Salmonella Paratyphi A and Typhi genomes: convergence or divergence by homologous recombination?
- PMID: 17090663
- PMCID: PMC1716267
- DOI: 10.1101/gr.5512906
A bimodal pattern of relatedness between the Salmonella Paratyphi A and Typhi genomes: convergence or divergence by homologous recombination?
Abstract
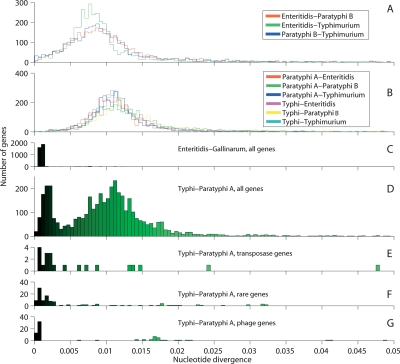
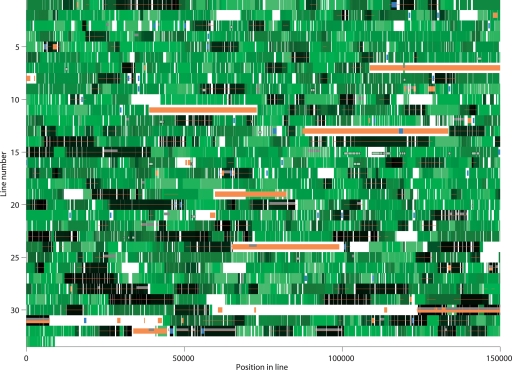
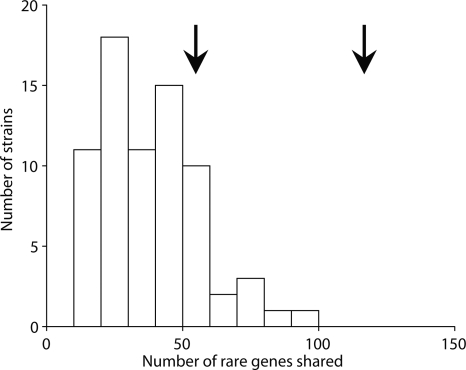
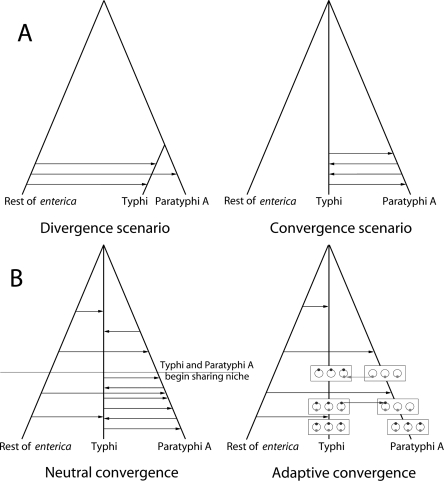
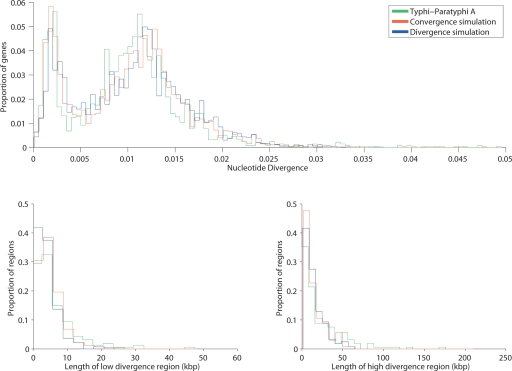
All Salmonella can cause disease but severe systemic infections are primarily caused by a few lineages. Paratyphi A and Typhi are the deadliest human restricted serovars, responsible for approximately 600,000 deaths per annum. We developed a Bayesian changepoint model that uses variation in the degree of nucleotide divergence along two genomes to detect homologous recombination between these strains, and with other lineages of Salmonella enterica. Paratyphi A and Typhi showed an atypical and surprising pattern. For three quarters of their genomes, they appear to be distantly related members of the species S. enterica, both in their gene content and nucleotide divergence. However, the remaining quarter is much more similar in both aspects, with average nucleotide divergence of 0.18% instead of 1.2%. We describe two different scenarios that could have led to this pattern, convergence and divergence, and conclude that the former is more likely based on a variety of criteria. The convergence scenario implies that, although Paratyphi A and Typhi were not especially close relatives within S. enterica, they have gone through a burst of recombination involving more than 100 recombination events. Several of the recombination events transferred novel genes in addition to homologous sequences, resulting in similar gene content in the two lineages. We propose that recombination between Typhi and Paratyphi A has allowed the exchange of gene variants that are important for their adaptation to their common ecological niche, the human host.
Figures
Similar articles
-
Pseudogene accumulation in the evolutionary histories of Salmonella enterica serovars Paratyphi A and Typhi.BMC Genomics. 2009 Jan 21;10:36. doi: 10.1186/1471-2164-10-36. BMC Genomics. 2009. PMID: 19159446 Free PMC article.
-
Comparison of genome degradation in Paratyphi A and Typhi, human-restricted serovars of Salmonella enterica that cause typhoid.Nat Genet. 2004 Dec;36(12):1268-74. doi: 10.1038/ng1470. Epub 2004 Nov 7. Nat Genet. 2004. PMID: 15531882
-
Complete genome sequence of Salmonella enterica serovar Sendai shows H antigen convergence with S. Miami and recent divergence from S. Paratyphi A.BMC Genomics. 2019 May 22;20(1):398. doi: 10.1186/s12864-019-5798-7. BMC Genomics. 2019. PMID: 31117944 Free PMC article.
-
Antimicrobial resistance in Salmonella enterica serovar typhi and paratyphi in South Asia-current status, issues and prospects.Crit Rev Microbiol. 2015;41(4):536-45. doi: 10.3109/1040841X.2014.880662. Epub 2014 Mar 19. Crit Rev Microbiol. 2015. PMID: 24645636 Review.
-
So similar, yet so different: uncovering distinctive features in the genomes of Salmonella enterica serovars Typhimurium and Typhi.FEMS Microbiol Lett. 2010 Apr;305(1):1-13. doi: 10.1111/j.1574-6968.2010.01904.x. Epub 2010 Jan 20. FEMS Microbiol Lett. 2010. PMID: 20146749 Review.
Cited by
-
Impact of homologous and non-homologous recombination in the genomic evolution of Escherichia coli.BMC Genomics. 2012 Jun 19;13:256. doi: 10.1186/1471-2164-13-256. BMC Genomics. 2012. PMID: 22712577 Free PMC article.
-
Mismatch induced speciation in Salmonella: model and data.Philos Trans R Soc Lond B Biol Sci. 2006 Nov 29;361(1475):2045-53. doi: 10.1098/rstb.2006.1925. Philos Trans R Soc Lond B Biol Sci. 2006. PMID: 17062419 Free PMC article.
-
Loss of very-long O-antigen chains optimizes capsule-mediated immune evasion by Salmonella enterica serovar Typhi.mBio. 2013 Jul 16;4(4):e00232-13. doi: 10.1128/mBio.00232-13. mBio. 2013. PMID: 23860765 Free PMC article.
-
Inference of bacterial microevolution using multilocus sequence data.Genetics. 2007 Mar;175(3):1251-66. doi: 10.1534/genetics.106.063305. Epub 2006 Dec 6. Genetics. 2007. PMID: 17151252 Free PMC article.
-
A Comparison of Subtyping Methods for Differentiating Salmonella enterica Serovar Enteritidis Isolates Obtained from Food and Human Sources.Osong Public Health Res Perspect. 2013 Feb;4(1):27-33. doi: 10.1016/j.phrp.2012.12.005. Osong Public Health Res Perspect. 2013. PMID: 24159526 Free PMC article.
References
-
- Beuzon C.R., Chessa D., Casadesus J., Chessa D., Casadesus J., Casadesus J. IS200: An old and still bacterial transposon. Int. Microbiol. 2004;7:3–12. - PubMed
-
- Bisharat N., Cohen D.I., Harding R.M., Falush D., Crook D.W., Peto T., Maiden M.C., Cohen D.I., Harding R.M., Falush D., Crook D.W., Peto T., Maiden M.C., Harding R.M., Falush D., Crook D.W., Peto T., Maiden M.C., Falush D., Crook D.W., Peto T., Maiden M.C., Crook D.W., Peto T., Maiden M.C., Peto T., Maiden M.C., Maiden M.C. Hybrid Vibrio vulnificus. Emerg. Infect. Dis. 2005;11:30–35. - PMC - PubMed
-
- Carver T.J., Rutherford K.M., Berriman M., Rajandream M.A., Barrell B.G., Parkhill J., Rutherford K.M., Berriman M., Rajandream M.A., Barrell B.G., Parkhill J., Berriman M., Rajandream M.A., Barrell B.G., Parkhill J., Rajandream M.A., Barrell B.G., Parkhill J., Barrell B.G., Parkhill J., Parkhill J. ACT: The Artemis comparison tool. Bioinformatics. 2005;21:3422–3423. - PubMed
-
- Centers for Disease Control, Salmonella surveillance: Annual summary, 2004. US Department of Health and Human Services; Atlanta, Georgia: 2005.
Publication types
MeSH terms
Grants and funding
LinkOut - more resources
Full Text Sources